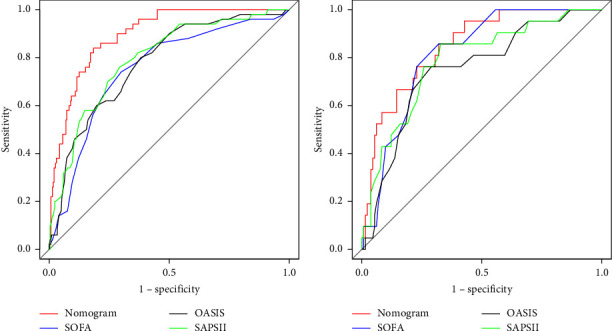
Figure 3.

ROC curves for the nomogram, SOFA, OASIS, and SAPS II in the training cohort (a) and validation cohort (b). The nomogram includes albumin, AST/ALT, GCS, glucose, peripheral vascular disease, potassium, PTT, and SPO2. In both groups, the nomogram had higher AUC values than SOFA, OASIS, and SAPS II.
