
Figure 3.
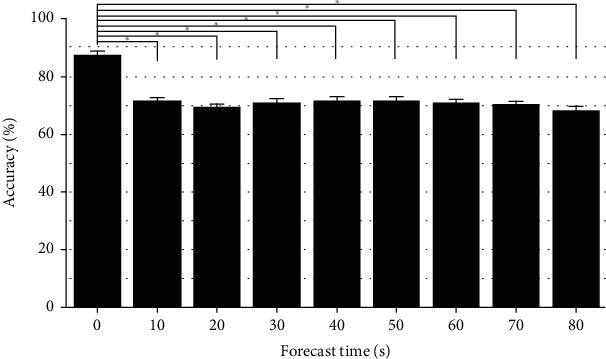
Average accuracies obtained when using the same forecast times over different data lengths. The asterisk (∗) indicates a statistically significant difference between the corresponding groups.
Official websites use .gov
A
.gov website belongs to an official
government organization in the United States.
Secure .gov websites use HTTPS
A lock (
) or https:// means you've safely
connected to the .gov website. Share sensitive
information only on official, secure websites.
Average accuracies obtained when using the same forecast times over different data lengths. The asterisk (∗) indicates a statistically significant difference between the corresponding groups.