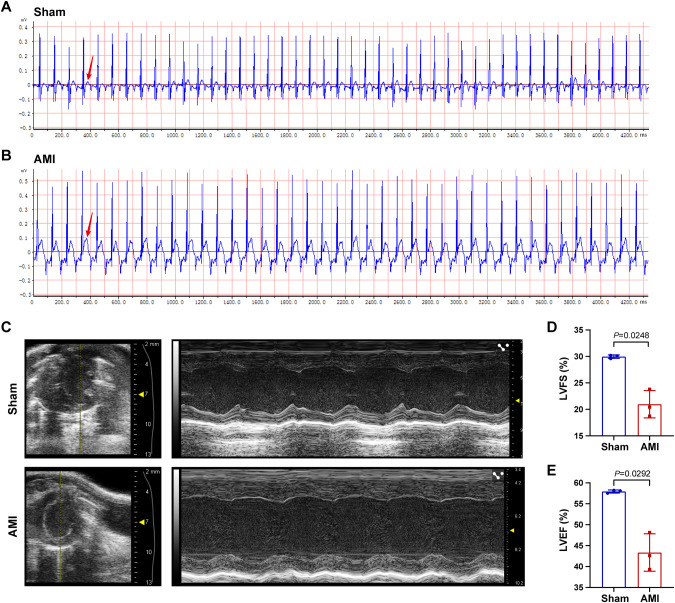
Fig. 6. AMI mouse model validation.
A, B Representative ECG images of AMI (n = 3) and sham animals (n = 3) were obtained after the cardiac surgery. The arrow noted that ST segment was elevated in AMI animals. C Representative echocardiography images of two groups at 24 h after the cardiac surgery. D, E Comparison of LVFS and LVEF in the two groups. ECG: electrocardiogram, LVFS: Left ventricular fractional shortening, LVEF: Left ventricular ejection fraction.

