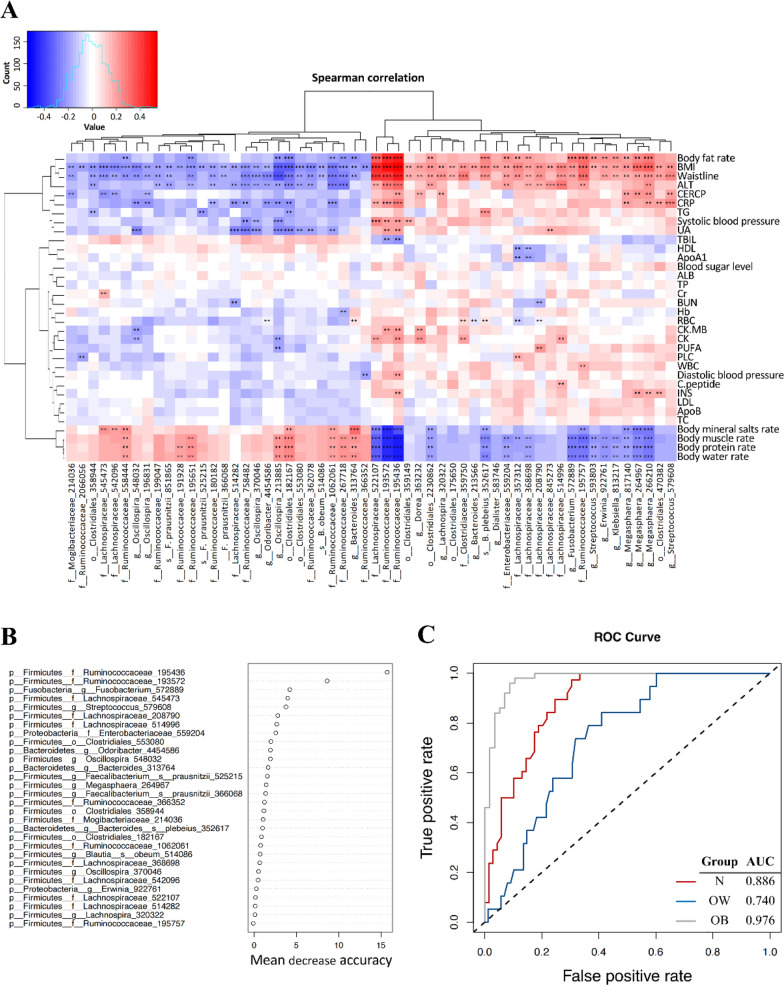
Fig. 3.
Identifying BMI-associated bacterial taxonomic biomarkers Shenzhen adolescents. A Heatmap of Spearman correlations between 56 BMI-associated bacterial taxa and serum biochemical parameters and body composition. Significance is given as **P < 0.01 and ***P < 0.001. B Thirty BMI-discriminatory bacterial taxa were identified by the RF model which were listed in rank order of their contribution to the classification accuracy (mean decrease accuracy). C ROC curve of the RF model

