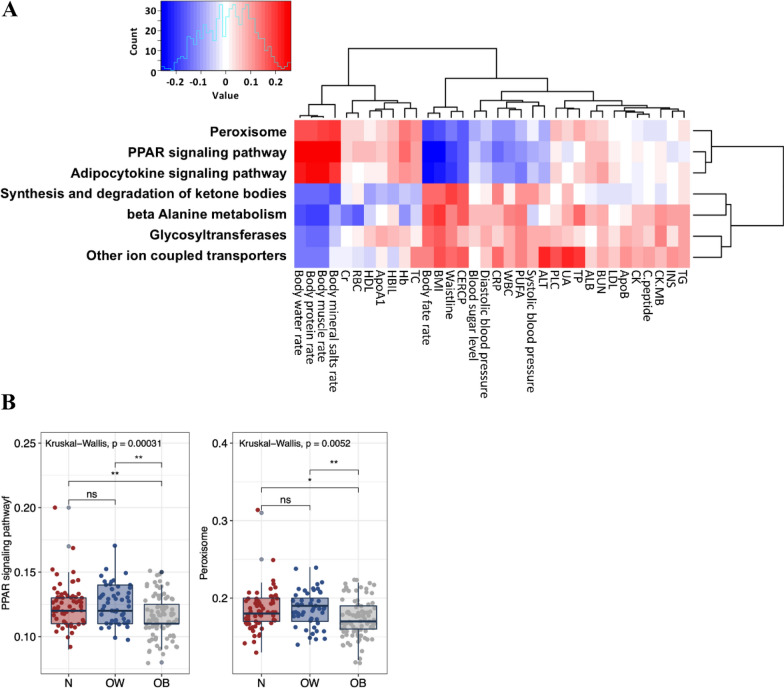
Fig. 4.
Functional divergence of gut microbiota across different BMI groups. A Predicted KEGG pathways that significantly correlated with BMI, and their associations with the boy composition and serum biochemical parameters. B KEGG pathways that are differentially expressed by the gut microbiome of the BMI categories. Each bar plot indicates the mean proportion of sequences assigned to a feature in each group. Whiskers represent 1.5* inter-quartile range. Relative abundances of were analyzed by Kruskal–Wallis test followed by post-hoc Tukey HSD test (*P < 0.05; **P < 0.01, and ***P < 0.001). N, normal-weight; OW, overweight; OB, obese

