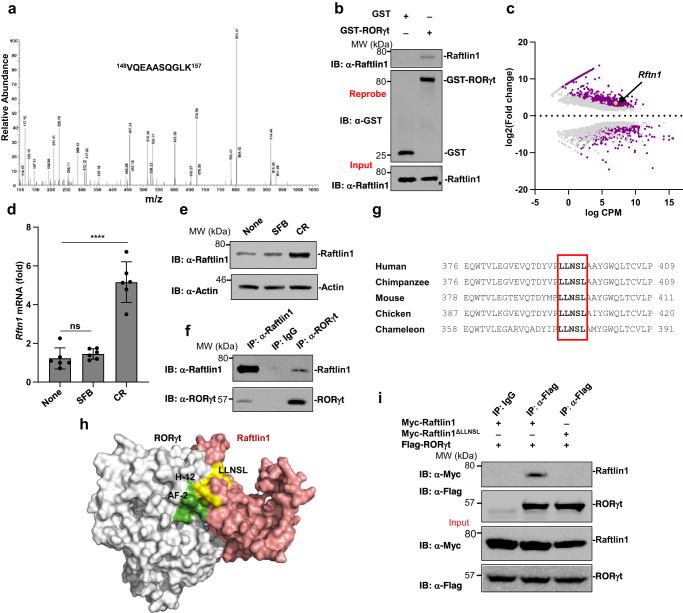
Fig. 1. Raftlin1 is upregulated in pathogenic Th17 cells and binds to RORγt.
a MS spectrum of peptide 148VQEAASQGLK157 corresponding to Raftlin1 (UniProt accession No: Q6A0D4). Observed b- and y-ions are indicated. b The lysates from CD4+ T cells isolated from colonic lamina propria of C. rodentium infected WT mice were pulled-down with purified recombinant GST or GST-RORγt followed by Immunoassays with anti-Raftlin1 and anti-GST antibody. c GEO dataset (GSE130302) was analyzed (n = 2 C. rodentium-infected and n = 3 SFB-colonized colon) and presented as the MA plot showing the change in expression (log2 fold change) and counts per million (log CPM values); p < 0.05, FDR < 0.05. d Rftn1 mRNA expression was analyzed by real-time PCR using CD4+ T cells isolated from colonic lamina propria; n = 6 mice per group. Data are presented as mean value ± SD, p = 0.00010 (CR), p = 0.37 (SFB). e Immunoassays of Raftlin1 protein in the lysates of CD4+ T cells. f the lysates of CD4+ T cells isolated from colonic lamina propria of C. rodentium infected mice were subjected to immunoprecipitation with anti-Raftlin1 or anti-RORγt antibody and immunoblot analysis with anti-RORγt or anti-Raftlin1 antibody. g Sequence alignment of Raftlin1; box indicates the conserved LLNSL motif. h Putative protein-protein interface from the docking model is shown in color gray for RORγt and Salmon for Raftlin1. Helix 12 (labeled) and AF2 (green) domains of RORγt are involved in non-covalent interaction in the modeled RORγt-Raftlin1 complex. LLNSL region of Raftlin1 is shown in color yellow. i Lysates from HEK293T cells transfected with various combinations of plasmids encoding Flag-RORγt and either Myc-Raftlin1 or Myc-Raftlin1ΔLLNSL, followed by immunoprecipitation with anti-Flag antibody and immunoblot analysis with anti-Myc or anti-Flag antibody. Immunoblots in (b, e, f, i) are from one experiment representative of three independent experiments with similar results. Statistical significance was determined by unpaired Student’s t test (two-tailed) in (c, d) with p < 0.05 considered statistically significant. ****p < 0.0001; ns- not significant. Source data are provided as a Source data file.

