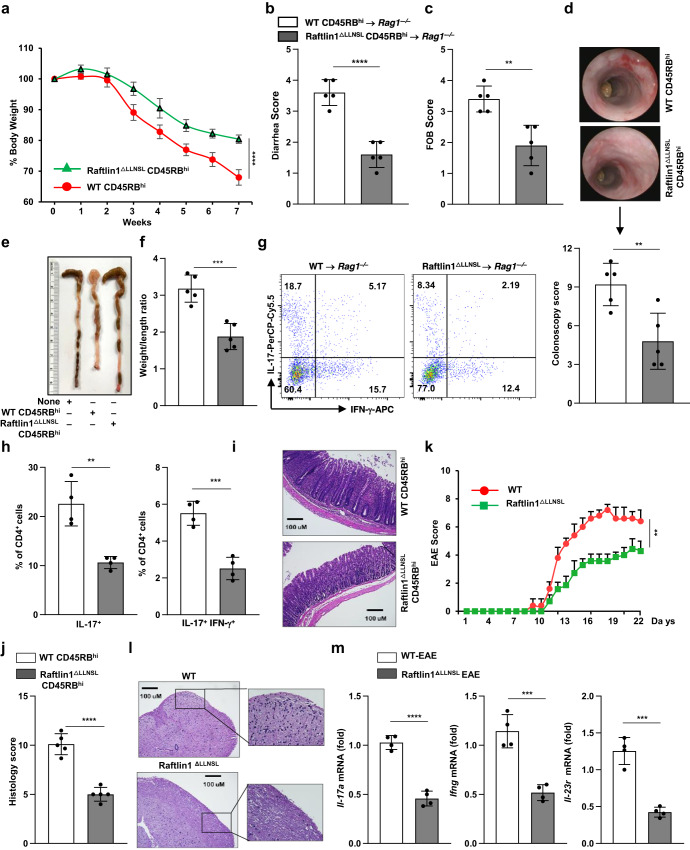
Fig. 4. Deletion of the LLNSL motif of Raftlin1 attenuates the pathogenicity of Th17 cells.
CD4+CD25–CD45RBhi cells were FACS sorted from WT and Raftlin1∆LLNSL mice and were adoptively transferred to Rag1–/– mice. a Percent change in body weight; n = 5 mice per group, p = 0.00010. b, c Diarrhea score and fecal occult blood (FOB) score; n = 5 mice per group, p = 0.00006 (diarrhea score), p = 0.0025 (FOB). d Colonoscopy images and scores; n = 5 mice per group, p = 0.0068. e Representative image of colon length. f Colon weight/length ratio; n = 5 mice per group, p = 0.0005. g Representative image of colonic lamina propria cells stained with antibodies against CD4, and intracellularly for IL-17 and IFN-γ, and analyzed by flow cytometry; n = 4 mice per group. h Corresponding quantification of total IL17+ and IL-17+ IFN-γ+ in CD4+ cells from colonic lamina propria cells of Rag1–/– mice; n = 4 mice per group, p = 0.0022 (IL17+), p = 0.0005 (IL-17+ IFN-γ+). i Microscopic images of H&E-stained colonic sections. The image is representative of five independent experiments. Scale bars, 100 μm. j Histology scores; n = 5 mice per group, p = 0.00002. k WT, and Raftlin1ΔLLNSL mice were immunized with MOG35-55 peptide in complete Freund’s adjuvant. Clinical EAE scores (0–10 severity scale); n = 5 WT and 7 Raftlin1∆LLNSL mice, p = 0.0013. l H&E-stained sections of the spinal cord. Image is representative of four independent experiments. Scale bars, 100 μm. m Expression of Il-17a, Ifng, and Il-23r were analyzed by real-time PCR in those spinal cords; n = 4 mice per group, p = 0.00003 (Il-17a), p = 0.0005 (Ifng), and p = 0.0001 (Il-23r). Data are from one experiment representative of three independent experiments with similar results. Statistical significance was determined by unpaired Student’s t test (two-tailed) in (a–d, f, h, j, k, m) with p < 0.05 considered statistically significant. **p < 0.01; ***p < 0.001; ****p < 0.0001, error bars are mean ± SD. Source data are provided as a Source data file.

