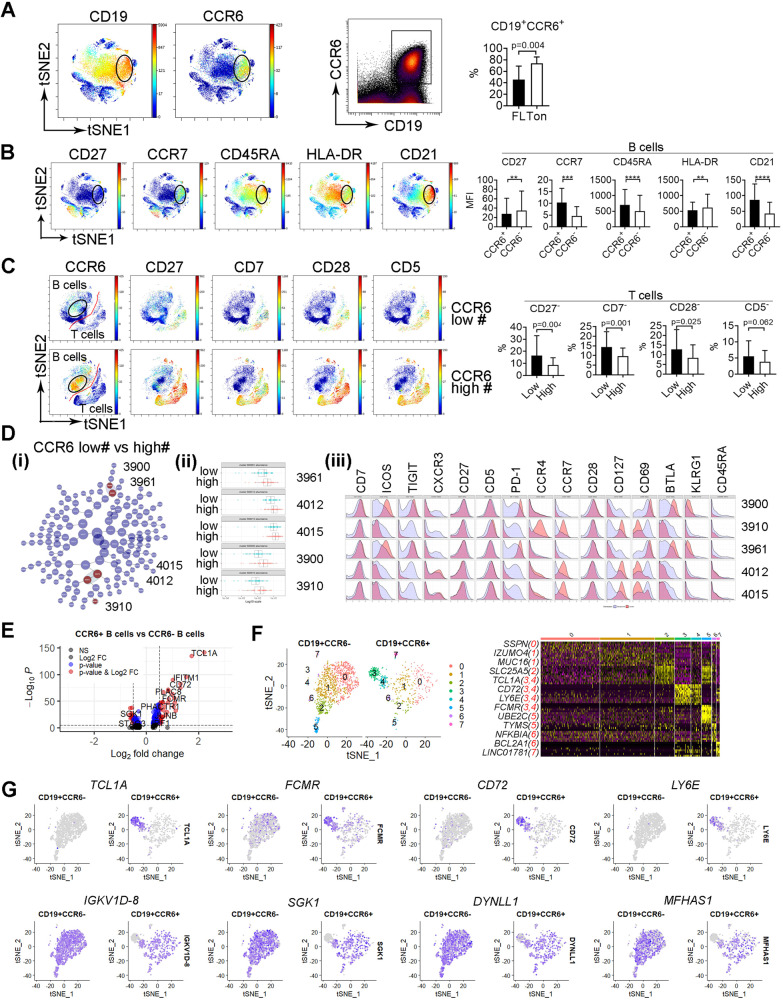
Fig. 3. CCR6 expression defines B cells as a population with early differentiation stage that correlates with decreased deficiency of costimulatory receptors in T cells.
A The tSNE and dot plots from a representative FL biopsy specimen showing expression of CD19 and CCR6 in CD45+ cells. Graphs showing percentage of CD19+CCCR6+ cells from 4 tonsil tissue and 82 FL specimens. B The tSNE plots of CD45+ cells showing expression of CD27, CCR7, CD45RA, HLA-DR, and CD21 from a representative specimen. Graphs showing mean fluorescent intensity (MFI) of surface markers above in CD19+CCR6+ and CD19+CCR6− cells. C The tSNE plots of CD45+ cells showing expression of CCR6, CD27, CD7, CD28 and CD5 from patients with low or high number of CCR6+ cells. Graphs showing percentage of surface markers above in patients with low or high number of CCR6+ cells. D CITRUS plot showing clustering result from FL patients between patients with low or high number of CCR6+ cells. Circles in red represent clusters that differed between groups and number in circles indicates a cluster ID (i). Histogram plots showing expression of selected markers by cells from clusters overlaid on background staining (ii). Graph showing quantitative results of abundance from clusters (iii). E Volcano plots showing genes (dots) of upregulation (red), downregulation (blue) or no change (black) from CITE-seq analysis based on Log2 FC and adjusted p value. P < 0.05 indicates statistically significant. F The tSNE plot showing clusters from CD19+CCR6− and CD19+CCR6+ cells based on gene expression profile from CITE-seq analysis. Heatmap showing gene expression by clusters from the tSNE plot. Representative genes were listed with cluster number in red. G The tSNE plots showing expression of genes TCL1A, FCMR, CD72, LY6, IGKV1D-8, SGK1, DYNLL1, and MFHAS1 from CD19+CCR6− and CD19+CCR6+ cells in FL biopsy specimens.

