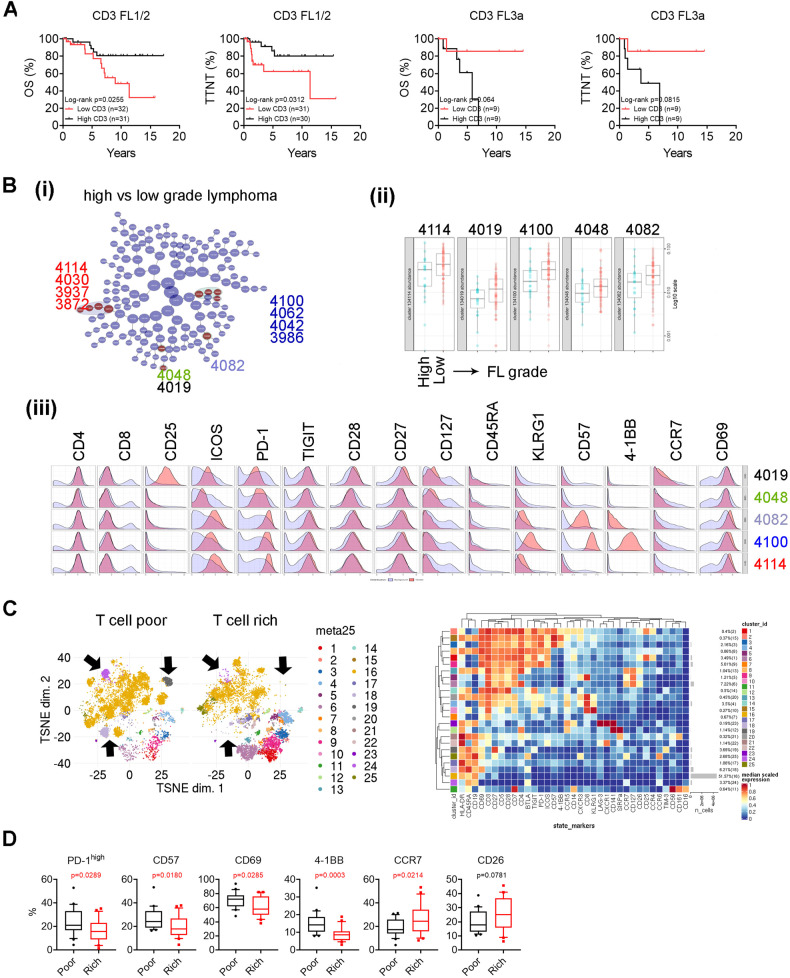
Fig. 4. T cell phenotype is associated with histological grade in FL.
A Kaplan–Meier curves of CD3 + T cells for OS and EFS in FL1/2 (n = 62) or FL3a (n = 20) patients using median number as cutoff point. B CITRUS plot showing clustering result from FL patients between patients with low- or high-grade lymphoma. Circles in red represent clusters that differed between groups and number in circles indicates a cluster ID (i). Graph showing quantitative results of abundance from clusters (ii). Histogram plots showing expression of selected markers by cells from clusters overlaid on background staining (iii). C The tSNE plots of CD45+ cells representing patients with either poor or rich in T cell number. Arrows to point to clusters that differed between patient groups. The heatmap (right) showing the phenotype and abundance (%) of each cluster. D Graphs showing percentage of PD-1high, CD57+, CD69+, CCR7+ and CD26+ cells in patients with either poor or rich in T cell number.

