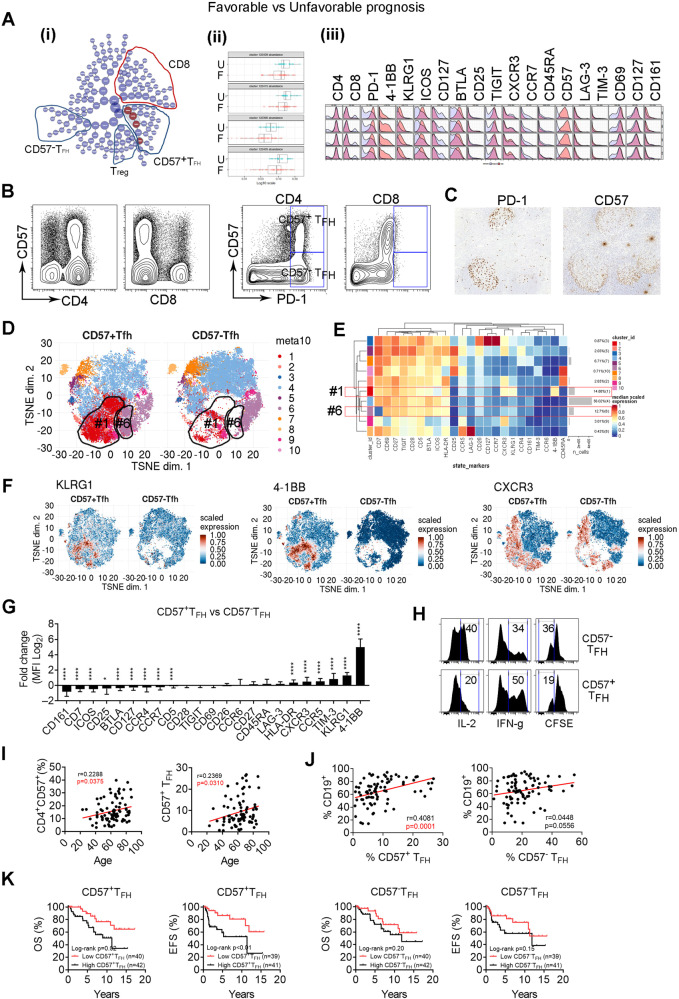
Fig. 5. CD57+ TFH cells are highly represented in patients with disease progression and correlate with inferior patient outcomes in FL.
A CITRUS plot showing clustering result from FL patients between patients with CR/PR (favorable) and SD/Prog (unfavorable). Circles in red represent clusters that differed between groups (i). Graph showing quantitative results of abundance from clusters (ii). Histogram plots showing expression of selected markers by cells from clusters overlaid on background staining (iii). B Dot and tSNE (below) plots showing CD57 expression as well as coexpression of CD57 and PD-1 on CD4+ or CD8+ T cells. C Immunohistochemistry images showing PD-1 and CD57 staining on a tissue section from a FL patient, n = 2. Strong staining of PD-1 and CD57 were seen on cells within follicles. D The tSNE plots showing clusters from CD57+ and CD57− TFH cells based on surface marker expression profile from CyTOF analysis. Circled were clusters 1 and 6 to show difference between CD57+ and CD57− TFH cells. E Heatmap showing surface marker expression by clusters identified from Fig. 5d. The right column shows the percentage of each cluster. Cluster #1 and #6 were highlighted. F The tSNE plots showing expression of surface markers KLRG1, 4-1BB and CXCR3 from CD57+ TFH and CD57− TFH cells. Graphs showing the percentage of CD57+ cells in CD4+ and CD8+ T cells. (G) Graph showing fold change (log2) of surface marker expression in CD57+ versus CD57− TFH cells. H Histograms showing expression of IL-2, IFN-γ and CFSEdim on CD57+ or CD57− TFH cells measured by flow cytometry, n = 3. I Scatter plots showing correlation between patient age and percentage of CD4+CD57+ or CD57+ TFH cells. J Scatter plots showing correlation between percentage of CD19+ cells and CD57+ or CD57− TFH cells. K Kaplan–Meier curves for OS and EFS of FL patients (n = 80) by the number of CD57+ or CD57− TFH cells using median number as cutoff point.

