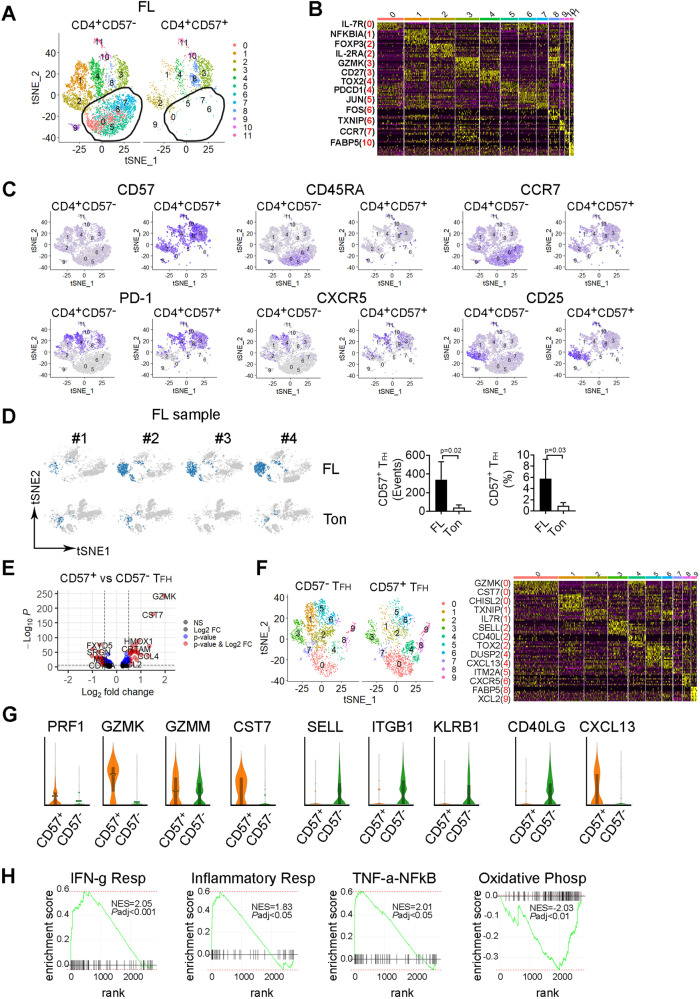
Fig. 6. CD57+ TFH cells are transcriptionally different from CD57− TFH cells and exhibit a gene expression profile of senescence.
A The tSNE plot showing clusters from CD4+CD57+ and CD4+CD57− cells based on gene expression profile from CITE-seq analysis. B Heatmap showing expression of upregulated genes (yellow) by clusters identified from Fig. 6A. Representative upregulated genes were listed from each cluster with the cluster number in red. C The tSNE plots showing expression of surface markers CD57, CD45RA, CCR7, PD-1, CXCR5 (gene), and CD25 from CD4+CD57+ and CD4+CD57− cells in FL biopsy specimens. D The tSNE plots of CITEseq analysis showing the content of CD57+ TFH cells in 4 individual samples from FL and tonsil (Ton). Graphs showing number of events (cell counts) and percentage (in total mononuclear cells, MNC) of CD57+ TFH cells in FL and Ton. E Volcano plots showing genes (dots) of upregulation (red), downregulation (blue) or no change (black) from CITE-seq analysis based on Log2 FC and adjusted p value. P < 0.05 indicates statistically significant. F The tSNE plot showing clusters from CD57+ and CD57− TFH cells based on gene expression profile from CITE-seq analysis. Heatmap showing gene expression by clusters from the tSNE plot. Representative genes were listed with cluster number in red. G Violin plots showing expression level of genes of PRF1, GZMK, GZMM and CST7, SELL, ITGB1 and KLRB1 as well as CD40LG and CXCL13 in CD57+ or CD57− TFH cells. H GSEA plots showing enriched gene sets related to signaling pathways. NES normalized estimation score. NES with a positive or negative score indicates upregulation or downregulation, respectively.

