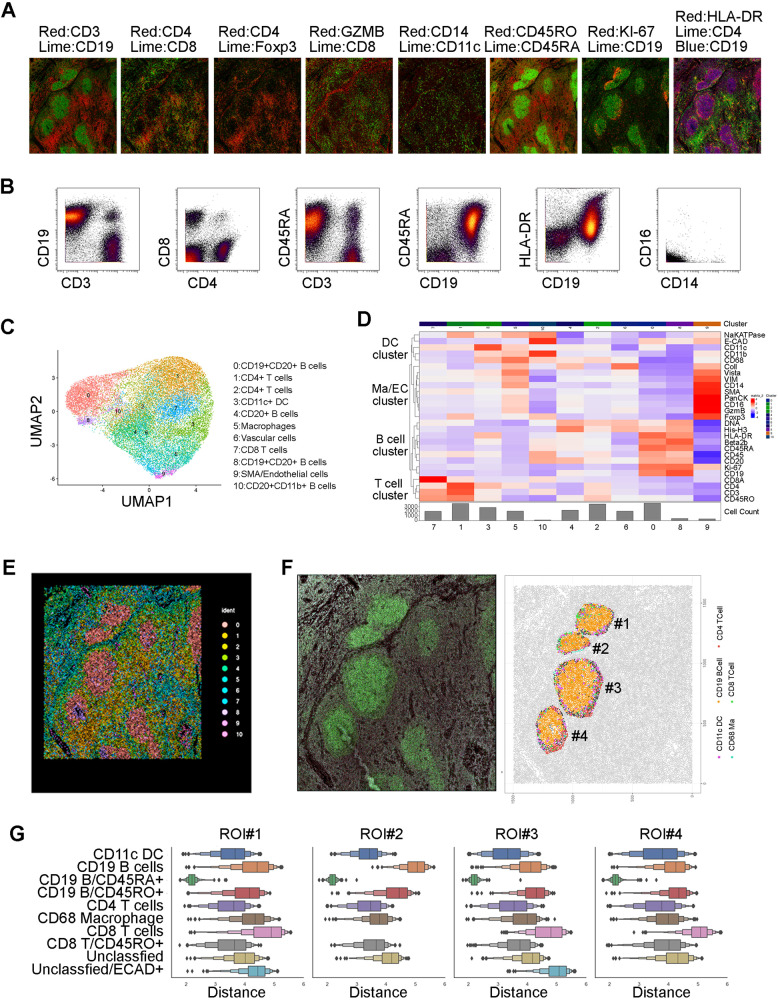
Fig. 7. Spatial profiling of the TME in FL.
A Stained images from multiplex imaging mass cytometry (MxIMC) using Hyperion from a region of interest (ROI) from a representative FL specimen. The whole slide was stained with 26 metal-conjugated antibodies and ROI were selected for Hyperion to scan. The images were viewed and merged using the MCD viewer (Fluidigm). B Dot plots showing surface marker expression by CyTOF from the same patient in (A). C, D The UMAP and Heatmap plots of cells from ROI of a representative FL patient. The data was extracted from segmentation process and analyzed with the R program (Seurat). 11 clusters were generated and annotated based on phenotype. E A spatial point plot with each color representing and indicating the origin of clusters from (C, D). The point is the X & Y coordinate of the centroid of each cell. This plot was analyzed and generated with the Seurat package. F CD19 staining (in Green) (left) alongside a spatial point plot produced using SciMap and color matching (right). G Distance plots, log of micron boxplots, using all the CD19+/CD45RA+ cells as the basis of pairwise comparisons by distance. Each boxplot was the distribution of that population’s distance away from all the CD19+/CD45RA+ cells, within each sub-regional annotation.

