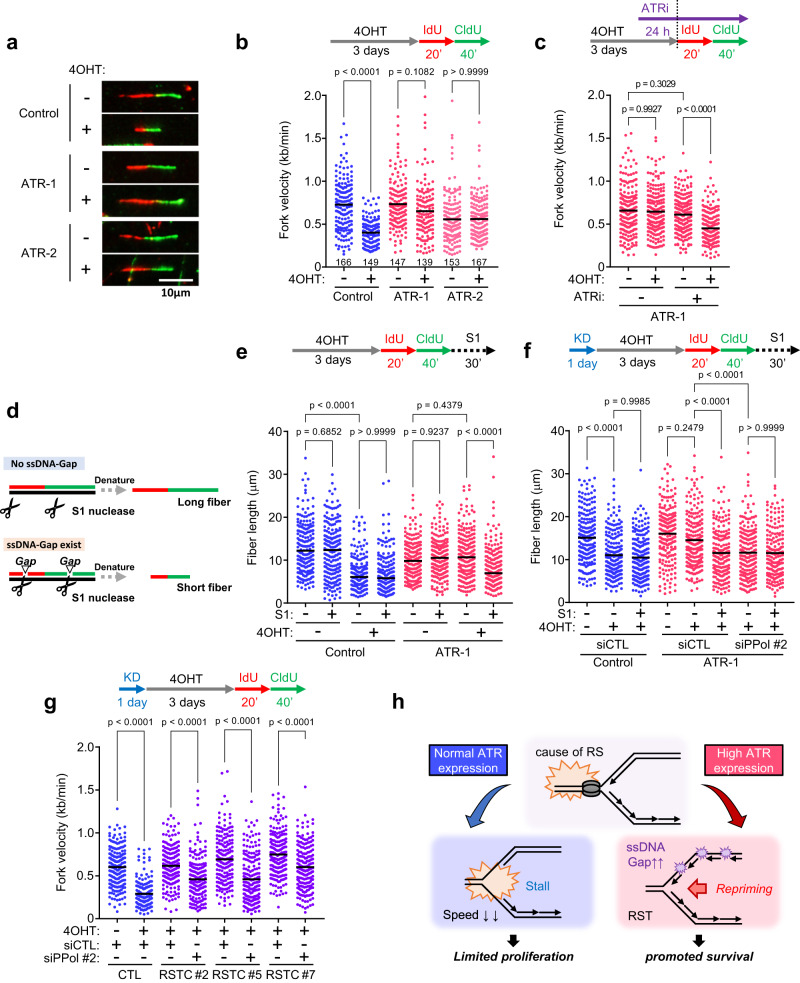
Fig. 2. Elevated ATR expression maintains fork speed by promoting PrimPol-dependent repriming.
a, b Fork speed in Control, ATR-1 and ATR-2 cells treated with 0.1 μM of 4OHT for 3 days. a Representative images of DNA fibers. IdU (red) was treated for 20 min followed by CldU (green) for 40 min, then visualized by denature protocol. Scale bar = 10 μm. b Dot plot and mean of fork speed. Representative result of three independent reproducible experiments are shown. Black lines indicate the mean; n ≥ 139; one-way ANOVA Tukey’s test. c Dot plot and mean of fork speed in ATR-1 cells treated with 0.1 μM of 4OHT for 3 days. 1 nM of ATRi (Berzosertib) was added 24 h prior to IdU/CldU labeling. Representative result of two independent reproducible experiments are shown. d Schematic for detection of ssDNA gap by ssDNA specific S1 nuclease. Before denaturing of DNA fiber, DNA were cleaved by 10 U/ml of S1 nuclease. e Dot plot and mean of fiber lengths in Control and ATR-1 cells treated with 0.1 μM of 4OHT for 3 days with or without 10 U/ml of S1 nuclease for 30 min. Representative result of three independent reproducible experiments are shown. f Dot plot and mean of fiber lengths in Control and ATR-1 cells transfected with 1 nM of siControl or siPrimPol for 24 h and treated with 0.1 μM of 4OHT for 3 days with or without 10 U/ml of S1 nuclease for 30 min. Representative result of two independent reproducible experiments are shown. g Dot plot and mean of fork speed in parental Control cells and RSTC clones #2, #5 and #7 transfected with 1 nM of siControl or siPrimPol for 24 h and treated with 0.1 μM of 4OHT for 3 days. Representative result of two independent reproducible experiments are shown. h Proposed ATR-PrimPol mediated RST model. In response to acute and chronic RS induced by KRASG12V, elevated ATR expression promotes PrimPol-dependent repriming to maintain fork speed but allows cell to generate ssDNA, resulting in high risk of genomic instability. c, e, f, g Black lines indicate the mean; n = 200; one-way ANOVA Tukey’s test. All source data are provided as a Source Data file.

