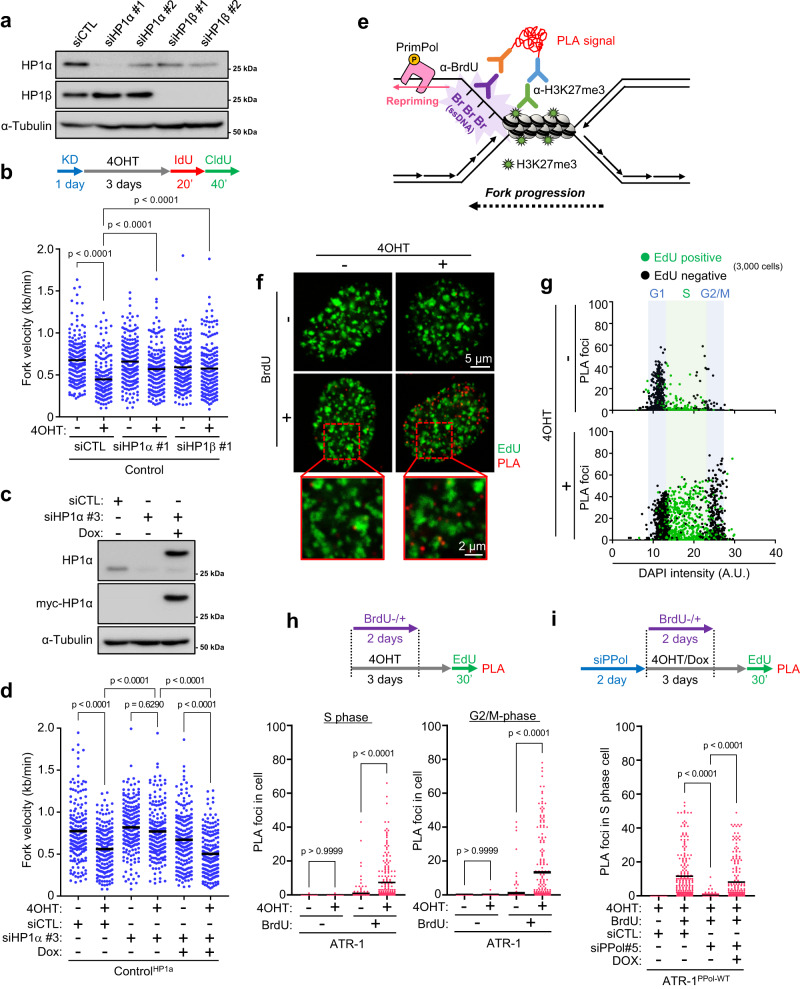
Fig. 5. PrimPol-dependent repriming occurs at the locally compacted chromatin region.
a Control cells were transfected with 1 nM of two independent siRNAs of HP1α and HP1β for 24 h. The expression level of HP1α and HP1β were analyzed by western blotting. b Dot plot and mean of fork speed in Control cells transfected with 1 nM of siControl, siHP1α or siHP1β for 24 h and treated with 0.1 μM of 4OHT for 3 days. Representative result of two independent reproducible experiments are shown. c Control cells harboring doxycycline-inducible myc-HP1α were transfected with 1 nM of siControl or siUTR-HP1α (siHP1α #3) for 24 h and treated with 1 μg/ml of doxycycline for 24 h. The expression level of myc-tag HP1α and α-Tubulin were analyzed by western blotting. d Dot plot and mean of fork speed in Control cells harboring doxycycline-inducible myc-HP1α transfected with 1 nM of siControl or siHP1α #3 for 24 h and treated with 0.1 μM of 4OHT with or without 1 μg/ml of doxycycline for 3 days. Representative result of two independent reproducible experiments are shown. e Strategy of proximity ligation assay (PLA) to monitor ssDNA exposure near heterochromatin mediated by H3K27me3. After the siRNA transfection, cells were grown in 10 μM of BrdU-containing medium and incubated for 2 days before released into BrdU-free medium for 1 day. Cells were treated with 10 μM of EdU for final 30 min to label the S-phase cells, then PLA was performed using antibody against BrdU and H3K27me3. f–h The result of H3K27me3-BrdU PLA from three independent reproducible experiments with ATR-1 cells treated with 0.1 μM of 4OHT for 3 days. f Representative PLA foci image. Scale bar = 5 μm. Expanded images are shown in red square. Scale bar = 2 μm. g Scatterplots showing the number of PLA foci. 3,000 cells from each sample were randomly selected and plotted. EdU negative (black) and EdU positive (green) are indicated respectively. h Number of PLA foci in S phase or G2/M phase cells defined by EdU incorporation level shown in (5 g). i Number of PLA foci in S phase cells of ATR-1 cells harboring doxycycline-inducible myc-PrimPolWT transfected with 1 nM of siControl or siUTR-PrimPol (siPPil #5) for 2 days and treated with 0.1 μM of 4OHT with or without 1 μg/ml of doxycycline for 3 days. Representative result of three independent reproducible experiments are shown. b, d, h, i Black lines indicate the mean; n = 200; one-way ANOVA Tukey’s test. All source data are provided as a Source Data file.

