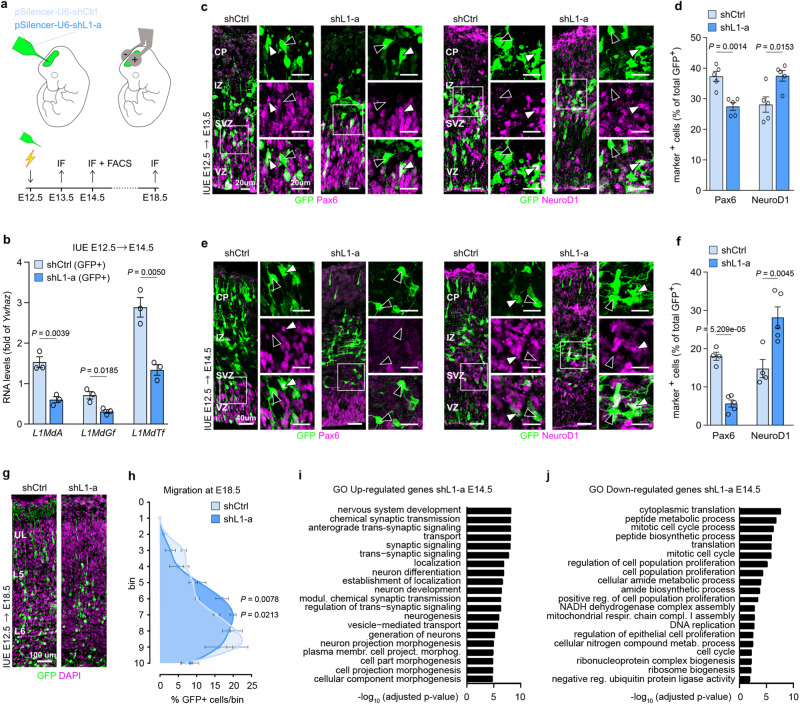
Fig. 1. L1 silencing alters neocortical development.
a Schematic of in utero electroporation (i.u.e.) procedure (up) and experimental timeline (bottom). b Expression of L1 transcripts in GFP+ cells from E14.5 cortices i.u.e with shCtrl or shL1-a. RNA levels are normalized on shCtrl group. Data are mean ± s.e.m. n = 3 technical replicates. Two-sided unpaired t-test. c, e Immunofluorescence staining for neuronal progenitor (Pax6) and pro-neuronal (NeuroD1) markers at E13.5 (c) and E14.5 (e). d, f Quantification of GFP+/marker+ cells at E13.5 (d) and E14.5 (f). Data are mean ± s.e.m.; E13.5: n = 5 each; E14.5: n = 4 shCtrl, n = 5 shL1-a. Two-sided unpaired t-test. g Immunofluorescence staining for DAPI and GFP at E18.5. h Radial distribution of GFP+ cells at E18.5. Data are mean ± s.e.m.; n = 4 shCtrl, n = 3 shL1-a. Multiple t-test with correction for multiple comparison with Sidak-Bonferroni’s test. i, j Top GO terms under the biological process category for up-regulated (i) and down-regulated (j) genes in mouse GFP+ cells after i.u.e. of shL1-a versus shCtrl. p values were determined by gprofiler2 using a default hypergeometric test and correction for multiple testing has been performed by the g:SCS algorithm. Source data are provided as a Source Data file.

