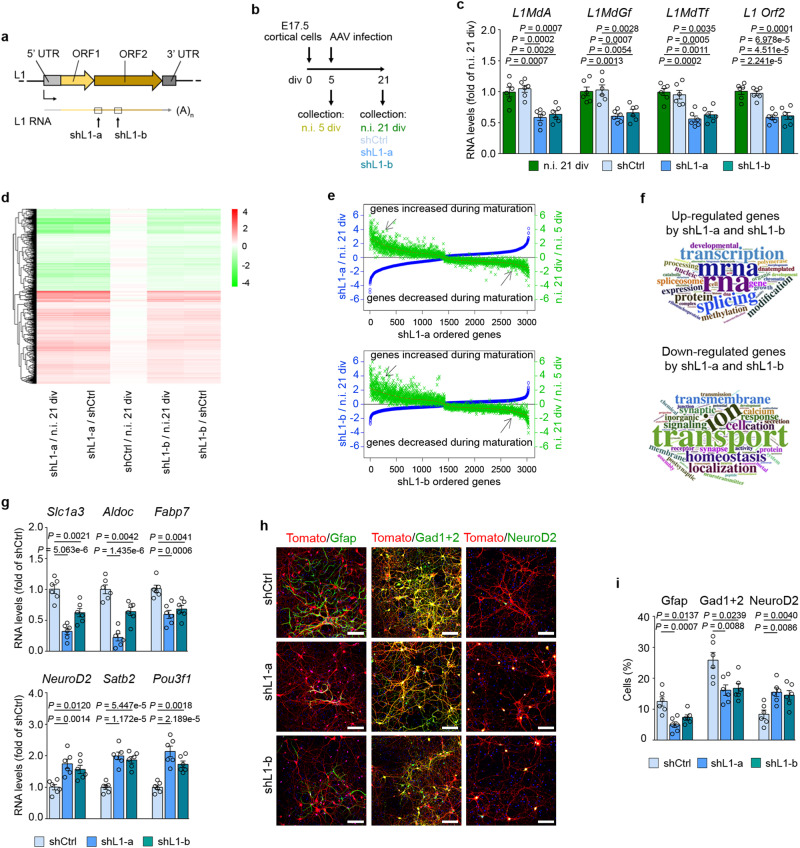
Fig. 2. L1 silencing impairs neuronal maturation.
a Schematic of the localization of shL1-a and shL1-b targeting L1 transcripts. b Schematic of the timeline of cortical cells infection. c Expression of L1 transcripts in cells infected with shCtrl, shL1-a and shL1-b. RNA levels are normalized on the non-infected (n.i.) group. d Heatmap of the log2 fold changes of DEGs in cells infected with shL1-a and shL1-b compared to n.i. or shCtrl. The rows correspond to the significant genes and the columns to the group comparisons. e Correlation analysis of DEGs in shL1-a (top) and shL1-b (bottom) and their normal expression pattern during maturation (n.i. 21 div versus n.i. 5 div). The y-axis reports the log2FC. The x-axis reports DEGs by shL1-a (top) or shL1-b (bottom). f Word cloud analysis of the top 50 significant GO terms under the biological process category for up-regulated (top) and down-regulated (bottom) genes. g Expression of cell type specific genes in cortical cells expressing shCtrl, shL1-a and shL1-b. RNA levels are normalized on shCtrl. h Immunofluorescence staining showing Synapsin-Tomato, Gfap, Gad1 + 2 and NeuroD2 expression. Scale bar = 100 µm. i Quantification of cells expressing Gfap, Gad1 + 2 and NeuroD2. For (c, g, and i), n = 6 independent samples. Data are mean ± s.e.m. One-way ANOVA with Tukey’s multiple comparisons test. Source data are provided as a Source Data file.

