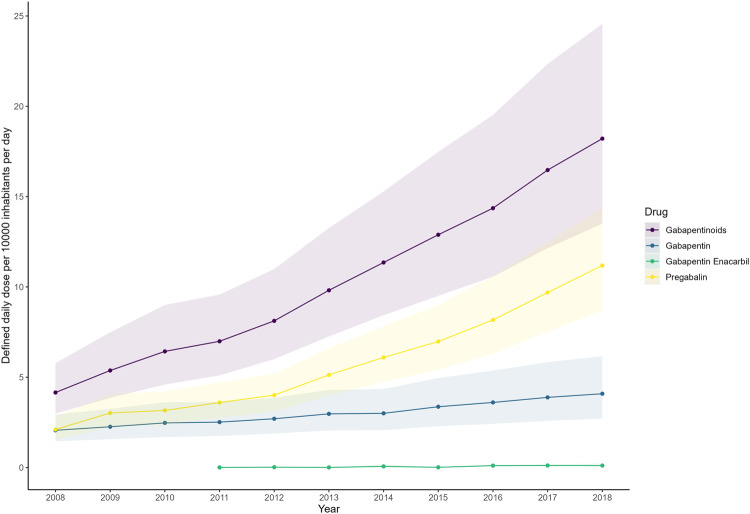
Fig. 1. Multinational gabapentinoid consumption from 2008 to 2018.
Multinational consumption levels are presented as pooled defined daily dose per 10,000 inhabitants per day with the shaded areas indicating the 95% confidence bands. The multinational consumption levels were computed by pooling the estimates from individual countries using a random-effects model. The multinational consumption levels of different gabapentinoid agents are presented with 95% confidence interval and different colours. Source data are provided as a Source Data file.

