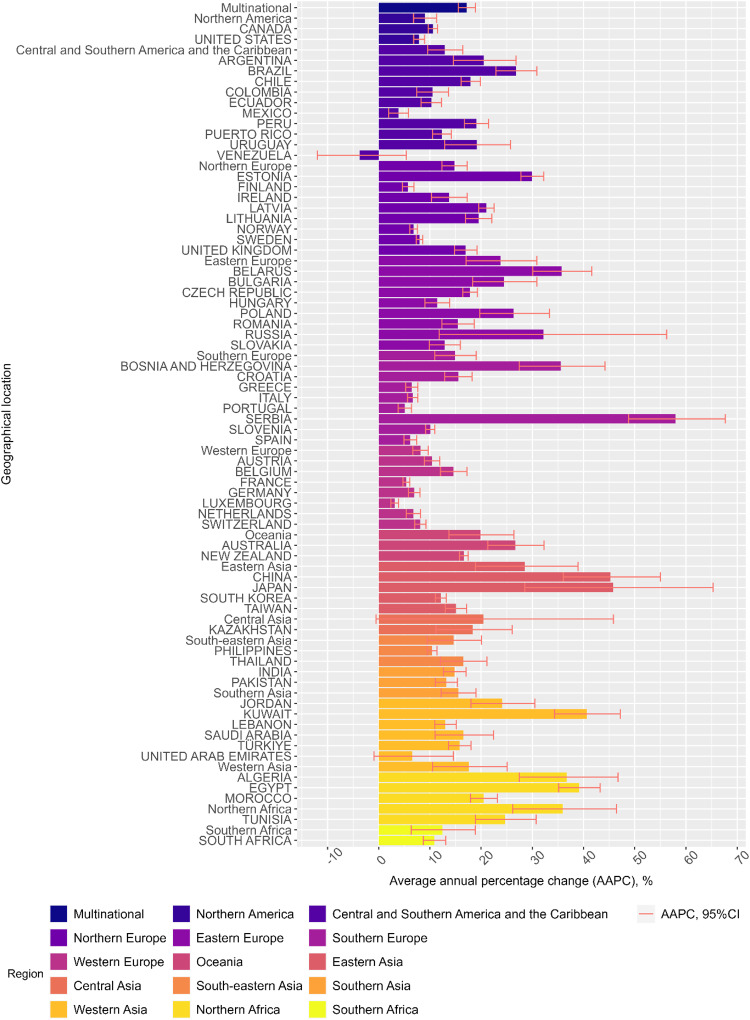
Fig. 4. Average annual percentage change of gabapentinoid consumption.
Different countries/regions’ average annual percentage change of gabapentinoid consumption are represented ± 95% confidence interval (error bar). Each country/region is represented with a different colour. The average annual percentage change is calculated using a linear regression model, with log-transformed consumption in DDD/TID as the dependent variable and year as the independent variable. The average annual change was expressed as average annual percentage change, calculated by [exp(the coefficient of the year variable) – 1] × 100%. The multinational and regional trend changes were estimated using linear mixed models, controlling for within-country correlations and assuming the correlations between years were autocorrelated. Source data are provided as a Source Data file.

