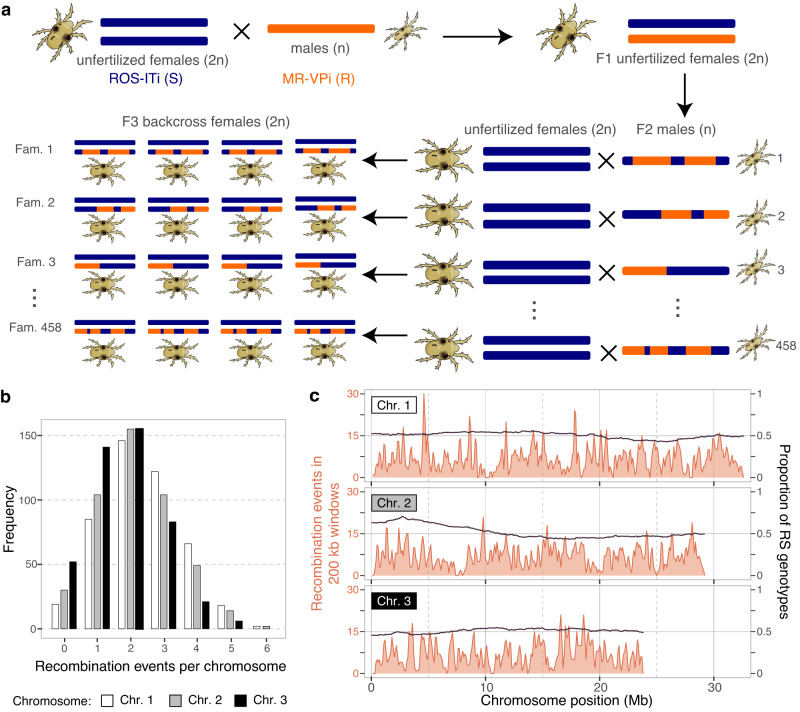
Fig. 1. Experimental design for eQTL mapping and distribution of recombination events.
a Diploid (2n) unfertilized females of strain ROS-ITi (susceptible strain, S, F0 generation) were collected and crossed to haploid (n) males of strain MR-VPi (resistant strain, R, F0 generation). Subsequently, haploid F2 males produced by F1 females were crossed individually to unfertilized S females (notice that the haploid F2 males have recombined chromosomes resulting from meiotic crossovers in their hybrid F1 mothers). Females in each of the resulting F3 families were full siblings and genetically identical because they each arose from a cross between one isogenic haploid male and S strain isogenic females. In total, 458 such F3 families were generated and used for RNA preparation (denoted Fam. 1–458). b Histogram of the recombination events for each of the three T. urticae chromosomes (Chr. 1–3) as assessed with the 458 F3 families using RNA-seq based genotypes. c The distribution of recombination events in the 458 families, as assessed with a sliding window analysis (200 kb window size with 100 kb steps; orange line; left axes), and the proportion of RS genotypes, as calculated every 50 kb (black line; right axes).

