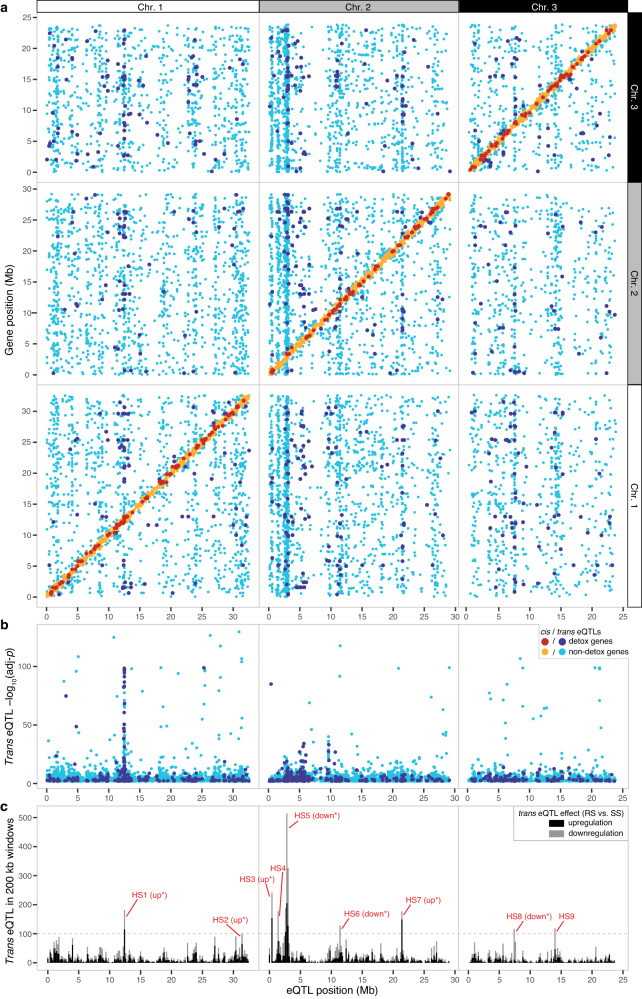
Fig. 2. Genomic distribution of eQTLs in the R × S mapping population.
a Scatter plot showing the position of significant eQTLs (x-axis, adj-p < 0.01) along with the respective target genes (y-axis). Colors of points distinguish cis eQTLs (yellow or red) from trans eQTLs (light or dark blue) as indicated in the legend (bottom right); red and dark blue indicate cis and trans eQTLs for genes in the detoxification gene set, respectively; otherwise, eQTLs are associated with non-detoxification genes. For display, associations are grouped by each of the three T. urticae chromosomes (Chr. 1–3) as indicated at the top and far right. b Log transformed adj-p (-log10) values for trans eQTLs (y-axis) by genomic position (x-axis). Each point is for a single trans eQTL (light and dark blue color coding are after a). c The number of trans eQTLs (based on bin midpoints) for which associated target genes are either up- or downregulated (stacked black and gray bars, respectively) in non-overlapping 200 kb windows across the T. urticae genome (x-axis) are indicated (legend, far upper right; up- and downregulation are defined in the comparison of expression levels of RS to SS genotypes at trans eQTL loci). For nine trans eQTL hotspots (HS1-HS9) with > 100 trans associations each, where a significant bias (adj-p < 0.05, denoted by an asterisk) in the direction of effect conferred by trans regulation was observed, “up” or “down” is given in parentheses (for HS1-HS9, respectively, chi-square goodness of fit test results are: χ2(1) = 12.66, p = 0.003; χ2(1) = 8.37, p = 0.035; χ2(1) = 18.00, p = 1.99 × 10⁻⁴; χ2(1) = 7.35, p = 0.060; χ2(1) = 38.09, p = 6.09 × 10-09; χ2(1) = 26.88, p = 1.94 × 10-06; χ2(1) = 85.38, p = 2.21 × 10⁻¹⁹; χ2(1) = 77.14, p = 1.44 × 10⁻¹⁷; and χ2(1) = 5.25, p = 0.197; p values adjusted with the Bonferroni method to account for multiple tests). For a and b, the p-values for eQTLs, corrected for multiple tests (adj-p values), are from the output of MatrixEQTL.

