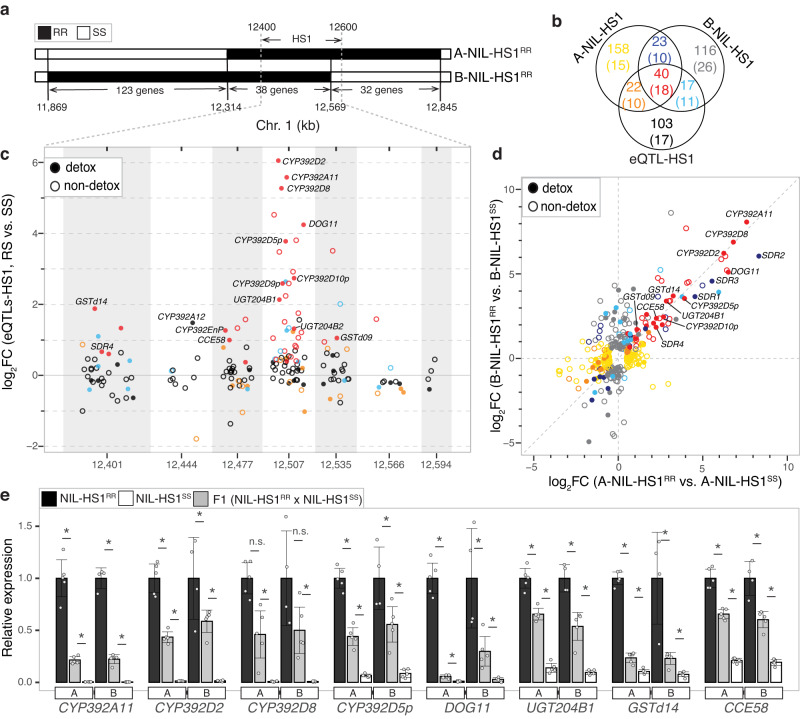
Fig. 3. Validation of trans eQTL HS1 using near-isogenic lines (NILs).
a Genomic region at and nearby the 200 kb HS1 window (12.4–12.6 Mb) on chromosome 1 showing the extent of the introgressed R haplotype in A-NIL-HS1RR and B-NIL-HS1RR (legend, upper left). The numbers of genes within the introgressed regions are indicated at the bottom. b Venn diagram showing the number and overlap of differentially expressed genes (adj-p < 0.01, and see Methods) in the comparison of A-NIL-HS1RR versus A-NIL-HS1SS (denoted A-NIL-HS1), B-NIL-HS1RR versus B-NIL-HS1SS (denoted B-NIL-HS1), and those genes with trans control originating from HS1 as determined by eQTL mapping (denoted eQTL-HS1). Numbers of detoxification genes are given in parentheses, and overlap classes are color coded. c For genes with trans eQTLs overlapping the HS1 window (genotype bins are in alternating gray and white, and bin midpoints in kb are indicated at bottom), log2 fold changes (log2FC) attributable to the respective genotypes at the trans eQTL loci at HS1 are shown on the y-axis. Within a bin, trans regulated genes (circles) are jittered to prevent plotting overlap, and are color coded after panel b. Detoxification genes are denoted with filled circles (legend, top left). d Scatter plot showing log2FC values for differentially expressed genes (from b) in either the A-NIL-HS1RR versus A-NIL-HS1SS or the B-NIL-HS1RR versus B-NIL-HS1SS comparisons (x-axis and y-axis, respectively; genes are color coded based on b). e Relative expression levels for a subset of highly differentially expressed detoxification genes in NIL-HS1RR and NIL-HS1SS for the A and B NIL sets along with the respective values for F1s. To facilitate comparisons, expression was normalized to values from A-NIL-HS1RR and B-NIL-HS1RR. Significant differences are indicated by asterisks (adj-p < 0.05*, DESeq2; n.s., not significant). For the bar plot, means, error bars of ±2 standard error, and all data points are shown. The differential gene expression analyses for NILs in b, e used p-values adjusted for multiple tests (adj-p values) as output by DESeq2 (n = 5 biologically independent replicates, except for B-NIL-HS1RR, for which n = 4 biologically independent replicates).

