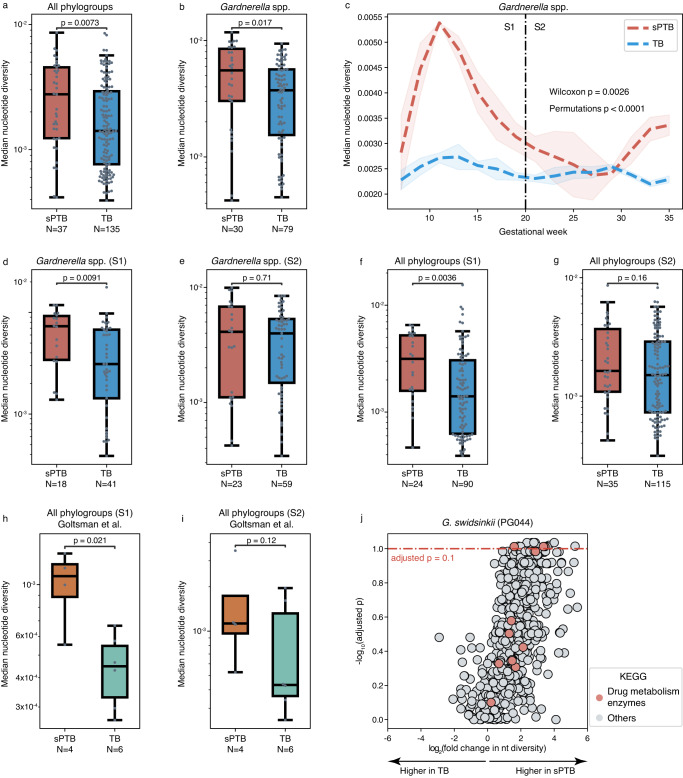
Fig. 2. Microdiversity patterns of the vaginal microbiome are associated with sPTB.
a, b A comparison of median genome-wide nucleotide diversity along pregnancy between sPTB and TB, displayed for all phylogroups (a) and Gardnerella spp. (b). p, two-sided Mann-Whitney. c Trajectory of median nucleotide diversity of Gardnerella spp. along pregnancy. S1 - first half of pregnancy; S2 - second half of pregnancy. The shaded area depicts mean ± s.d./n. p, one-sided Wilcoxon and permutation. d, e A comparison of median genome-wide nucleotide diversity of Gardnerella spp. between sPTB and TB, displayed for pregnancy S1 (d) and S2 (e). p, two-sided Mann-Whitney. f, g A comparison of median genome-wide nucleotide diversity of all phylogroups between sPTB and TB, displayed for pregnancy S1 (f) and S2 (g). p, two-sided Mann-Whitney. h, i Same as d–e, using data from the independent cohort of Goltsman et al.32. p, one-sided Mann-Whitney. j Volcano plot illustrating the significance (two-sided Mann-Whitney; y-axis) of difference between nucleotide diversity (fold change; x-axis) in sPTB and TB of every gene in G. swidsinskii (PG044). Genes above the red dashed line have P < 0.05 and an adjusted P < 0.1. Genes belonging to KEGG pathways that were significantly enriched in genes showing significant nucleotide diversity differences are color-coded (adjusted P < 0.1). Box, IQR; line, median; whiskers, 1.5*IQR.

