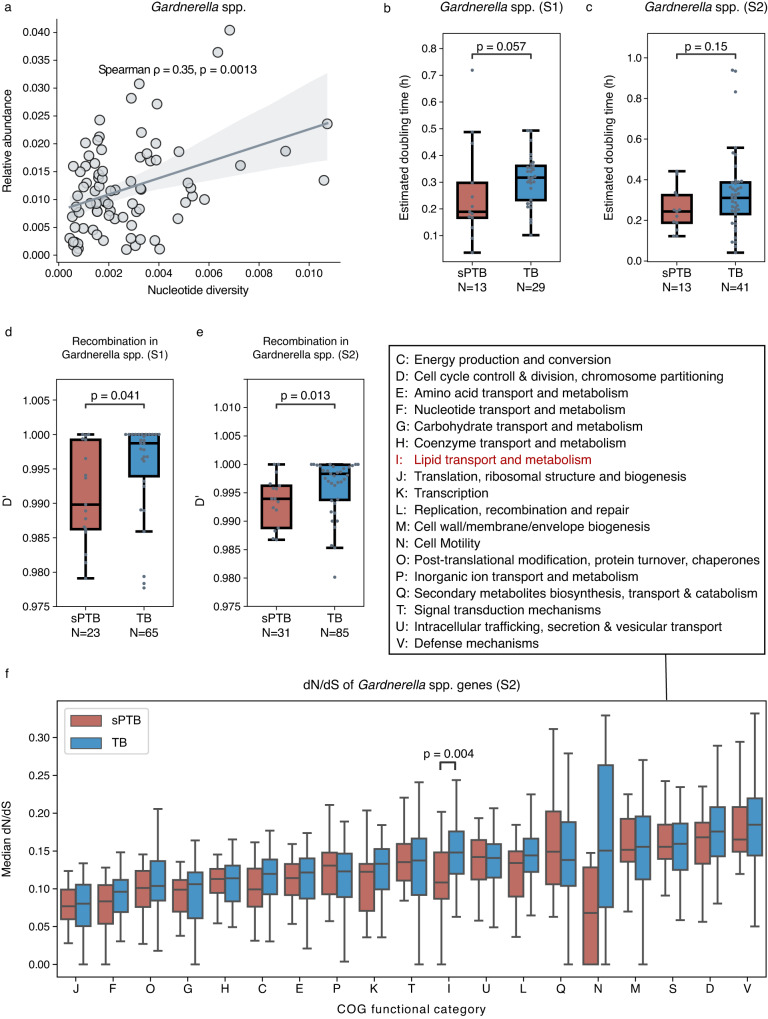
Fig. 3. Evolutionary forces on Gardnerella spp.
a Spearman correlation between median genome-wide nucleotide diversity and relative abundance of Gardnerella spp. along pregnancy. The line and the shaded area depict the best-fit trendline and the 95% confidence interval (mean ± 1.96 s.e.m.) of the linear regression. b, c Predicted maximal doubling time (gRodon36) of Gardnerella spp. compared between sPTB and TB, displayed for the first (b, S1) and second (c, S2) halves of pregnancy. d, e Median D’ of Gardnerella spp compared between sPTB and TB, displayed for the first (S1, d) and second (S2, e) halves of pregnancy. Lower D’ indicates more frequent recombination. f dN/dS of Gardnerella spp genes compared between sPTB and TB by COG functional categories, displayed for the second half of pregnancy (S2). dN/dS closer to 0 indicates stronger purifying selection. N = 40 and 135 for sPTB and TB, respectively, included in this panel. Box, IQR; line, median; whiskers, 1.5*IQR; p, two-sided Mann-Whitney.

