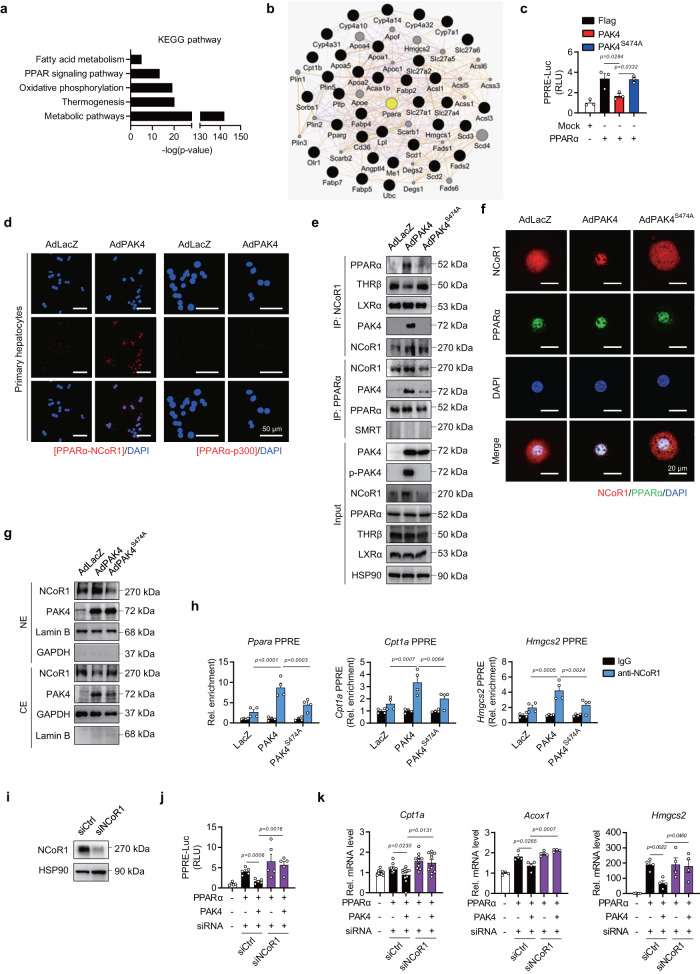
Fig. 4. PAK4 suppresses PPARα transcriptional activity by physically interacting with PPARα and NCoR1.
a, b KEGG pathway analysis of the DEGs from RNA-Seq (a) and GeneMANIA analysis showing an association of PPARα with the identified PPAR signaling pathway genes (b). c AML12 cells were co-transfected with PPARα expression plasmid, a firefly luciferase gene under the control of three tandem PPAR response elements (PPRE), and the plasmids encoding PAK4 or PAK4S474A. PPRE-luciferase activities were measured and expressed as the fold change relative to Mock (n = 3). d–g Primary hepatocytes were infected with the adenoviruses expressing control (AdLacZ), PAK4 (AdPAK4), or kinase-inactive mutant PAK4S474A (AdPAK4S474A), as indicated. PPARα binding to NCoR1 or p300 was analyzed with an in situ proximity ligation assay (PLA, d). Red fluorescent spots indicate that PPARα and NCoR1 are closely interacting (scale bars, 50 µm). Cell lysates were immunoprecipitated with the antibodies against NCoR1 or PPARα, followed by immunoblotting with anti-PPARα, anti-THRβ, anti-LXRα, anti-PAK4, anti-NCoR1, and anti-SMRT antibodies (e). Representative confocal microscopy images showing an increase of NCoR1 in the nucleus by PAK4 (f, scale bars, 20 µm). Nuclear (NE) and cytosolic extracts (CE) were analyzed for NCoR1 (g). h ChIP-qPCR assay assessing NCoR1 recruitment to the PPRE promoter regions of Ppara, Cpt1a, and Hmgcs2 in mouse livers (n = 4). i–k AML12 were transfected with siRNA against NCoR1 (siNCoR1) or scrambled RNA (siCtrl) for 24 h, followed by transfection with the plasmids as indicated. Immunoblot images for NCoR1 (i), PPRE-luciferase activities (j, n = 5), and qPCR analysis (k) for Cpt1a (n = 10), Acox1, and Hmgcs2 (n = 4). Cpt1a carnitine palmitoyltransferase 1a, Acox1 acyl-CoA oxidase 1, Hmgcs2 3-hydroxy-3-methylglutaryl-CoA synthase 2, RLU relative luminescence unit. Data are presented as the mean ± SEM. One-way ANOVA followed by Tukey’s multiple comparisons test (c, h) and unpaired two-tailed t test (j, k) were conducted for statistical analyses. Source data are provided as a Source Data file.

