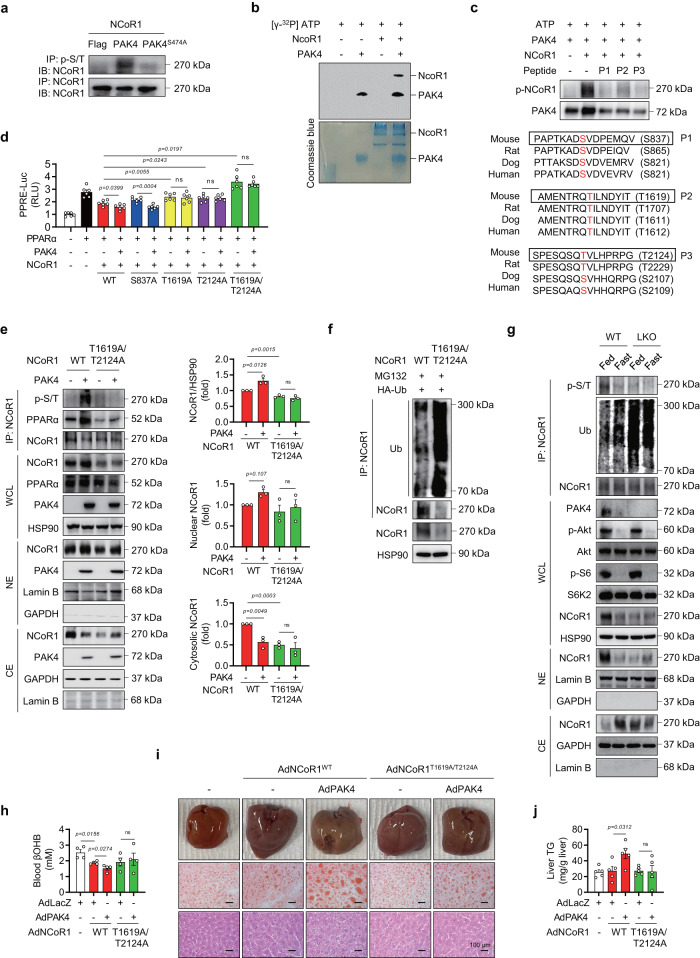
Fig. 5. PAK4 phosphorylates NCoR1.
a AML12 cells were transfected with the plasmids encoding PAK4 or PAK4S474A, along with NCoR1, as indicated. Phosphorylation of NCoR1 was analyzed by immunoblotting of NCoR1 after immunoprecipitation with a p-Ser/Thr antibody. b Recombinant NCoR1 was incubated with active PAK4 and [32P] ATP for 30 min at 31 °C. Proteins in the mixture were resolved by SDS-PAGE and visualized by autoradiography. Loading of proteins was confirmed by Coomassie blue staining. c In vitro peptide-competing kinase assay using synthetic oligopeptides comprising putative PAK4 target sites (P1: S837, P2: T1619, or P3: T2124) was performed. The diagram shows the sequence alignment of the putative phosphorylation sites of NCoR1 in various mammalian species. d PPRE-luciferase activities were measured in HEK293T cells co-transfected with PAK4, PPARα, and either wild-type (WT) or mutated NCoR1 (S837A, T1619A, T2124A, or T1619A/T2124A) (n = 6). e Co-IP and immunoblot analysis in HEK293T cells after co-transfection of NCoR1 (WT or T1619A/T2124A) and PAK4. Whole-cell lysates (WCL), nuclear extracts (NE), and cytosolic extracts (CE) were analyzed for NCoR1 protein levels and quantified (n = 3). f Ubiquitination of NCoR1 in HEK293T cells after co-transfection of HA-Ub and NCoR1 (WT or T1619A/T2124A). g Phosphorylation and ubiquitination of NCoR1 were analyzed in liver tissues from fed- or 24 h-fasted Pak4 LKO or WT mice. Protein levels of the indicated proteins were also analyzed in the WCL, NE, and CE. h–j Eight-week-old male C57BL/6 mice were injected with either adenoviruses expressing NCoR1 (AdNCoR1WT or AdNCoR1T1619A/T2124A), PAK4 (AdPAK4), or LacZ (AdLacZ), and were subsequently fasted for 24 h. Blood levels of βOHB (h, n = 4), gross liver morphology, and microscopic analysis (Oil Red O and H&E stain) of liver tissues (i, scale bars, 100 µm), as well as TG levels in the liver (j, n = 5), were compared. RLU relative luminescence unit, ns no significance. Data are presented as the mean ± SEM. Unpaired two-tailed t test was conducted for statistical analyses (d, e, h, j). *P < 0.05 and **P < 0.01. Source data are provided as a Source Data file.

