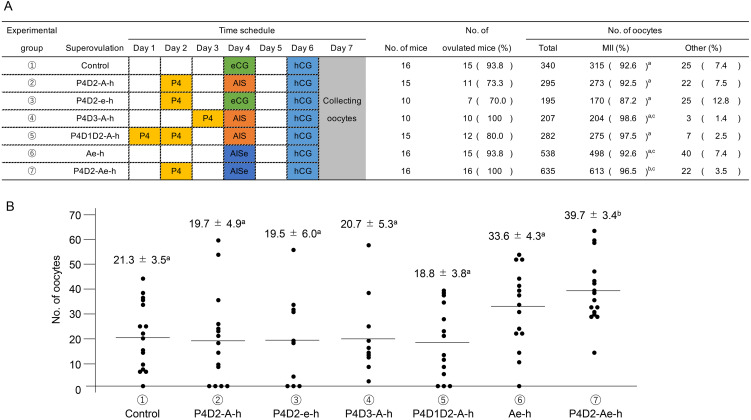
Fig. 1.
The time schedule of hormone injection and result of superovulation in each experimental group of young C57BL/6J strain. (A) Schematic representation of treatments to synchronize the estrus cycle and induce superovulation. Progesterone (P4) was injected subcutaneously in the neck, and the other hormones were injected intraperitoneally at 1700–1800 h on each day. In addition, results of the number of ovulated mice and oocytes are shown. The number of oocytes were counted with classifications based on their morphology. The oocytes with fragmentation, degeneration, regression, and small ooplasm were defined as “other”. These experiments were repeated at least thrice. Statistical differences were calculated according to one-way ANOVA and Tukey–Kramer’s test, as appropriate. Letters represent significant differences (P < 0.05). (B) The results of average number of oocytes in each superovulation procedure. Data represents means ± SEM. These experiments were repeated at least thrice. Statistical differences were calculated according to one-way ANOVA and Tukey-Kramer’s test, as appropriate. Letters represent significant differences (P < 0.05).

