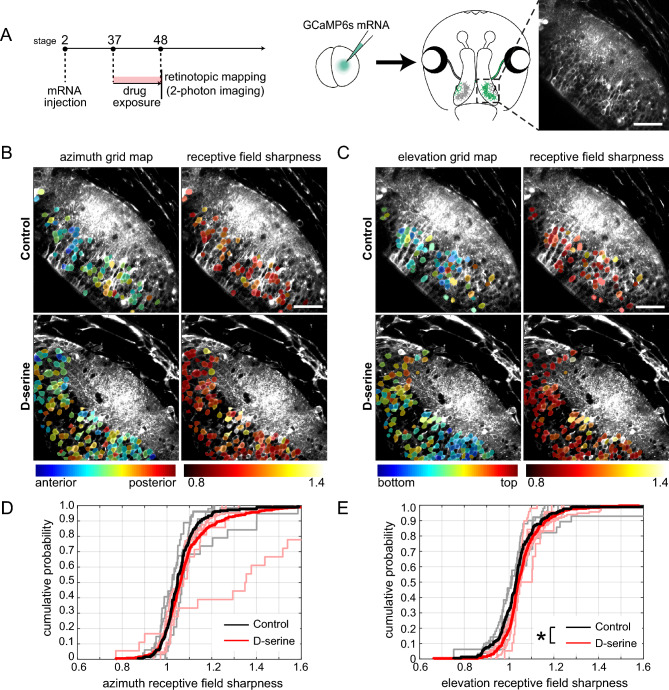
Figure 4.
Postsynaptic retinotopic maps in stage 48 animals reared in d-serine from stage 37. (A) Experimental design. mRNA for GCaMP6s was injected into one blastomere at the two-cell stage to generate tadpoles with mosaic GCaMP6s expression restricted to half the animal. Tadpoles were screened at stage 37 for GCaMP6s expression, then reared in control or d-serine for two-photon imaging of calcium fluorescence in the optic tectum at stage 48. Scale bar: 50 µm. (B, C) Representative images showing receptive field center locations (left) and receptive field sharpness (right) of individual tectal cells in response to a bar flashed at each of 5 locations across the (B) azimuth and (C) elevation axes. The maps are color-coded by the optimal stimulus position that evokes a response in each cell. Scale bar: 50 µm. (D, E) Cumulative probability distributions of receptive field sharpness of tectal cell bodies in individual animals (lighter lines) and grouped by treatment (darker lines) for the (D) azimuth [n = 365 cells from 6 animals for d-serine, n = 181 cells from 5 animals for control] and (E) elevation axes [n = 326 cells from 6 animals for d-serine, n = 172 cells from 5 animals for control. Kolmogorov–Smirnov test for pooled values *p < 0.05].

