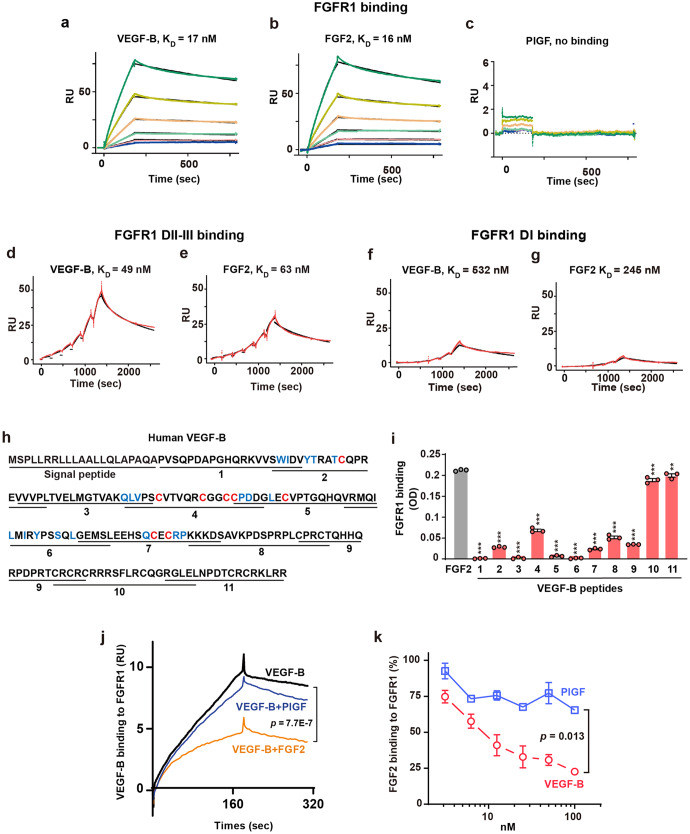
Fig. 1.
VEGF-B binds to FGFR1 and competes with FGF2 for FGFR1 binding. a–c Surface plasmon resonance (SPR) results showing VEGF-B binding to FGFR1 with a KD value (17 nM, a) similar to that for FGF2 (16 nM, b), whereas PlGF, another VEGFR1-binding member of the VEGF family, does not bind to FGFR1 (c). The lines from bottom to the top represent different concentrations of FGFR1-Fc: 12.5, 25, 50, 100, 200, and 400 nM, respectively. d, e SPR results showing VEGF-B binding to FGFR1 DII-III with a KD value (49 nM, d) similar to that of FGF2 (63 nM, e). The red lines are the resonance unit (RU) values at different concentrations of FGFR1 DII-III (25, 50, 100, 200, 400, 800 nM). The black lines are the fitted curves. f, g SPR results showing a very low binding affinity of VEGF-B (532 nM, f) and FGF2 (245 nM, g) to FGFR1 DI. The red lines are the RU values at different concentrations of FGFR1 DI (18.75, 37.5, 75, 150, 300, and 600 nM). The black lines are the fitted curves. h Scheme of the synthetic VEGF-B peptides. Blue: amino acids important for VEGFR1 binding. Red: eight cysteines forming the cysteine knots. i ELISA results showing the binding of VEGF-B peptides to FGFR1. n = 3. One-way ANOVA followed by Sidak post hoc analysis (number of comparisons against FGF2, 11) was used. Adjusted p values are <1.0E−10 for peptides 1–9, 1.0E−6 and 5.6E−3 for peptides 10 and 11. The experiment was repeated three times. j SPR results showing FGF2 competing with VEGF-B for FGFR1 binding, while PlGF does not. Kruskal-Wallis test with Dunn post hoc analysis (number of comparisons, 3) was used. k ELISA results showing VEGF-B dose-dependently competing with FGF2 for FGFR1 binding, while PlGF does not. Data are mean ± s.e.m. The experiment was repeated three times. Two-way ANOVA was used. **p < 0.01, ***p < 0.001

