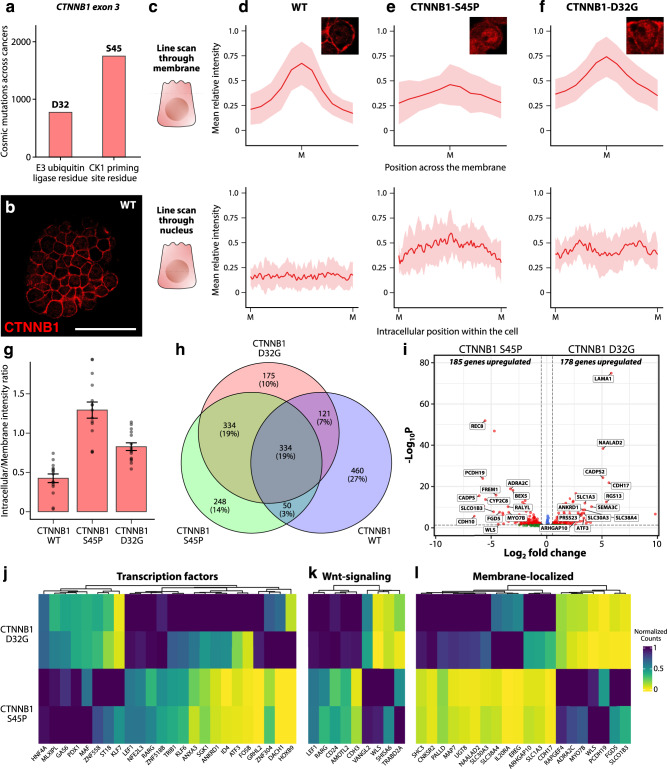
Fig. 2. Impaired localization of CTNNB1 upon hot-spot mutation induction by CBE and ABE.
a Amount of hot-spot mutations as quantified by the COSMIC database for somatic mutations in cancer. The y-axis shows number of mutations across all tumor types in the database. X-axis shows Amino acid residue location. b CTNNB1 is localized to the plasma membrane in wild-type organoids, while the intracellular levels are low. c Illustration of the line scans through the plasma membrane and nucleus to quantify CTNNB1 immunofluorescence intensity. d–f Quantification of mean relative intensity of CTNNB1 through the plasma membrane and cytoplasm/nucleus across wildtype (d), S45P (e), and D32G (f) genotypes (inset: representative cells for each genotype). Solid line represents the mean fluorescence intensity. Error band represents standard error of the mean (s.e.m.). g The CTNNB1 intensity ratio of intracellular to plasma membrane is significantly different across different mutants when compared to the wild-type control (n = 15 cells analyzed over two independent organoid clones). Bar plots are presented as mean values. Error bars represent standard error of the mean (s.e.m.). h Three-way venn diagram showing overlap of significantly enriched genes between wild type, S45P, and D32G genotypes. i Volcano plot showing genes that were differentially expressed between the S45P and D32G genotypes. Genes that have an absolute fold change of greater than 3 have been labeled. j–l Heatmaps showing transcription factors (j), Wnt-target genes (k), and the 20-most enriched membrane-bound genes (l) selected from all significantly enriched genes extracted from the volcano plot. Source data are provided as a Source data file.

