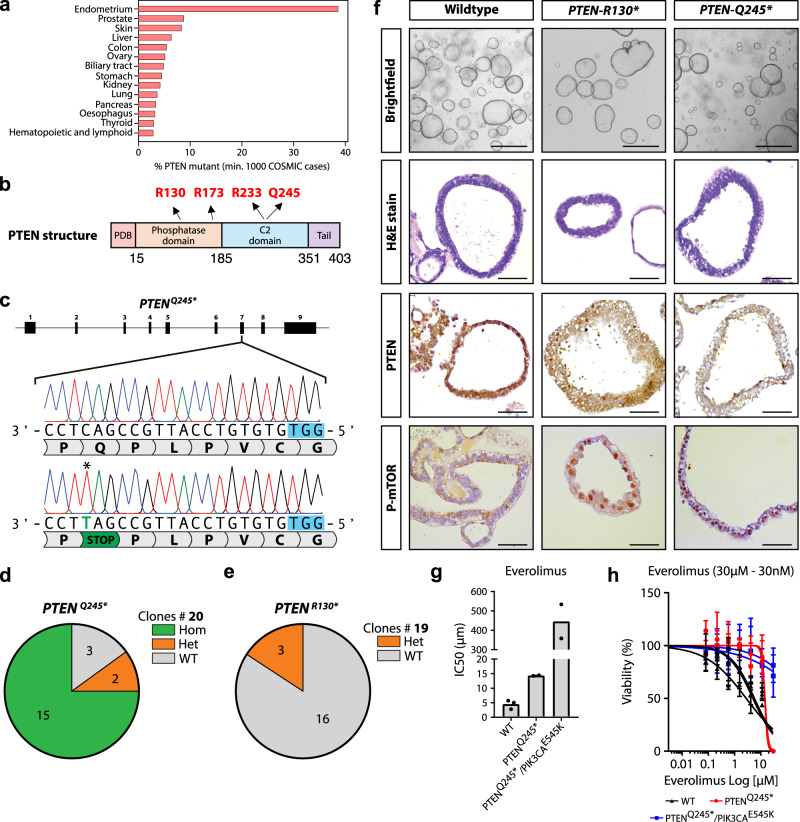
Fig. 3. CBE CRISPR-STOP effectively introduces nonsense mutations in PTEN in endometrial organoids.
a Bar graph displaying the percentage of PTEN mutations in various cancer types ordered according to frequency. The endometrium harbors the highest percentage of PTEN mutations. b Structure of the PTEN protein showing the different domains. Mutational hotspots are highlighted in red. c Sequence alignment of the PTENQ245 locus showing successful C > T transition. The PAM sequence is indicated in blue. The asterisk highlights the edited residue. d Pie chart reporting the efficiency of the PTENQ245* sgRNA. The number of clones per genotype is indicated. e Pie chart reporting the efficiency of the PTENR130* sgRNA. The number of clones per genotype is indicated. f Panel showing representative pictures of PTEN WT and mutant organoids. PTEN nonsense mutations result in lower immunoexpression of PTEN protein and increased phosphorylated mTOR expression. Scale bar 500 µm for brightfield and 50 µm for histology. g Dose–response curve reporting the sensitivity to Everolimus (mTOR inhibitor) of WT and PTEN, PTEN/PIK3CA mutant organoids. The viability is indicated on the Y-axis while the inhibitor concentration is indicated on the X-axis in logarithmic scale. Both mutants show reduced sensitivity. Data is derived from three technical replicates. h Bar graph representing the IC50 of Everolimus in different organoid lines, n = 3 (WT), n = 2 PTENQ245* and PTENQ245*/PIK3CAE545K. Statistics derived from three technical replicates. Data are presented as mean values +/− SD. Source data are provided as a Source data file.

