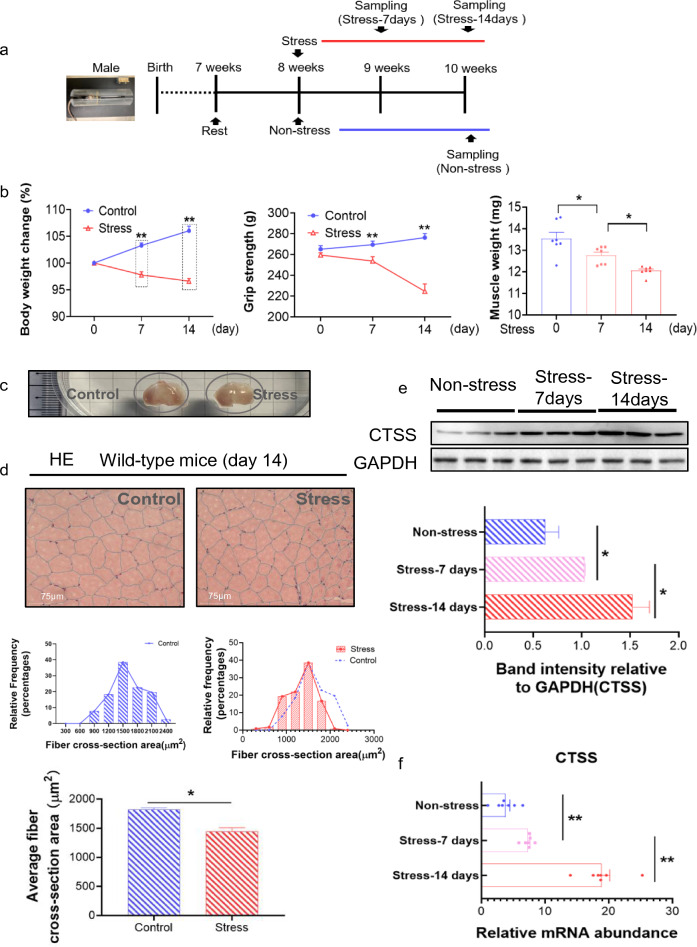
Fig. 1.
Chronic stress accelerated skeletal muscle mass loss and dysfunction. a: The mouse immobilized stress model. At the indicated time points after being subjected to variable stress, mice were sacrificed for biochemical and morphological analyses. b: Left panel: The body weight changes of CTSS+/+ mice with non-stress (Control) and a 14-day stress period (Stress) (n = 7 each). Middle panel: Grip strength analysis of Control and Stress mice (n = 7). Right panel: Gastrocnemius (GAS) muscle weights of Control and Stress mice (n = 7). c: Representative images of GAS muscle shape after sampling. d: Representative images of hematoxylin and eosin (H&E) staining of the GAS muscle sections of wildtype (CTSS+/+) mice. Scale bar: 75 µm and quantitative data showing the cross-sectional area of a GAS fiber (n = 5). e: Representative immunoblotting images and quantitative data for CTSS in GAS muscles at Days 7 and 14 after stress (n = 3). f: RT-qPCR analysis of CTSS in GAS muscle (n = 7, each group). The data are mean ± SEM, and p-values were determined by a two-way repeated measures ANOVA and Bonferroni’s post hoc tests (b: left panel and middle panel, e,f). One-way ANOVA followed by Tukey’s post hoc tests (b: right panel) or unpaired Student’s t-test (d). Control: CTSS+/+ control mice, Stress: CTSS+/+ 14-day-stressed mice. *p < 0.05; **p < 0.01; N.S, not significant

