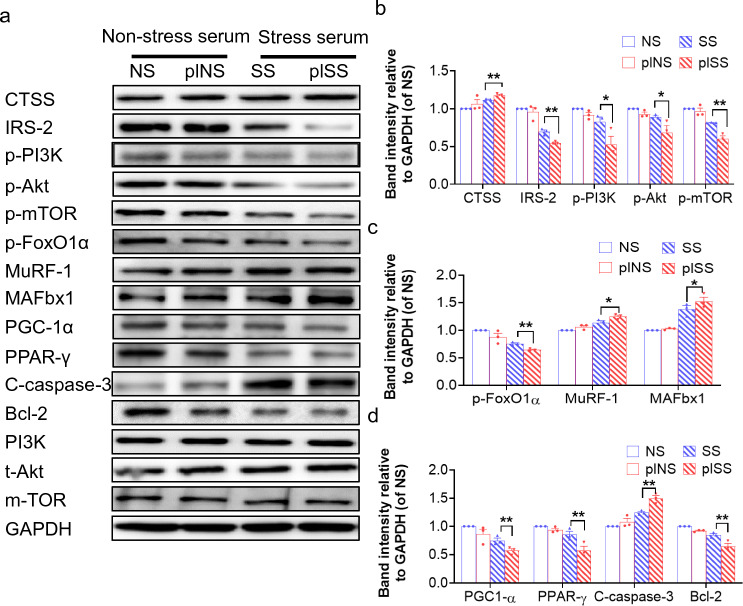
Fig. 10.
CTSS overexpression stimulated S-serum-induced C2C12 myoblast anabolic and catabolic molecular alterations. a-d: Representative immunoblotting images and quantitative data for CTSS, IRS-2, p-PI3K, p-Akt, p-mTOR, p-FoxO1α, MuRF-1, MAFbx1, PGC-1α, PPAR-γ, C-caspase-3, and Bcl-2 in the whole-cell lysates of the groups (n = 3). The data are mean ± SEM, and p-values were determined by one-way ANOVA followed by Tukey’s post hoc tests (b–d). NS: C2C12 cells treated with empty control plasmid were cultured in 5% NS-serum for 24 h, plNS: CTSS-overexpressed C2C12 cells cultured in 5% NS-serum for 24 h, SS: C2C12 cells treated with empty control plasmid were cultured 5% S-serum for 24 h, plSS: CTSS-overexpressed C2C12 cells cultured in 5% S-serum for 24 h. *p < 0.05; **p < 0.01

