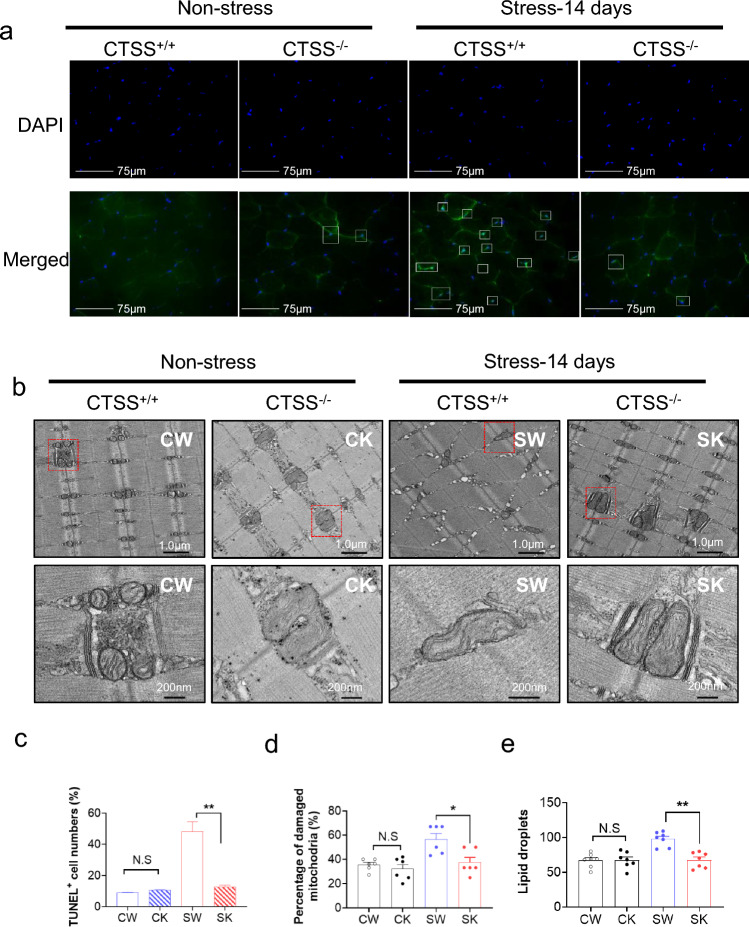
Fig. 5.
CTSS deletion alleviated muscle apoptosis and mitochondrial morphological changes in mice subjected to stress. a: Representative TUNEL staining used to assess the content of apoptotic cells. Yellow arrows: TUNEL-positive cells. c: Quantitative data for TUNEL-positive cells (n = 6). Scale bar: 75 µm. c–e: Representative images. b: Transmission electron microscopic images combined with quantitative data showing the percentage of damaged mitochondria (d) and the number of lipid droplets (e). Scale bars: 1.0 µm and 200 nm (n = 5). Data are mean ± SEM, and p-values were determined by one-way ANOVA followed by Tukey’s post hoc tests (b,d,e). CW, etc. are explained in the earlier figure legends. *p < 0.05; **p < 0.01; NS, not significant

