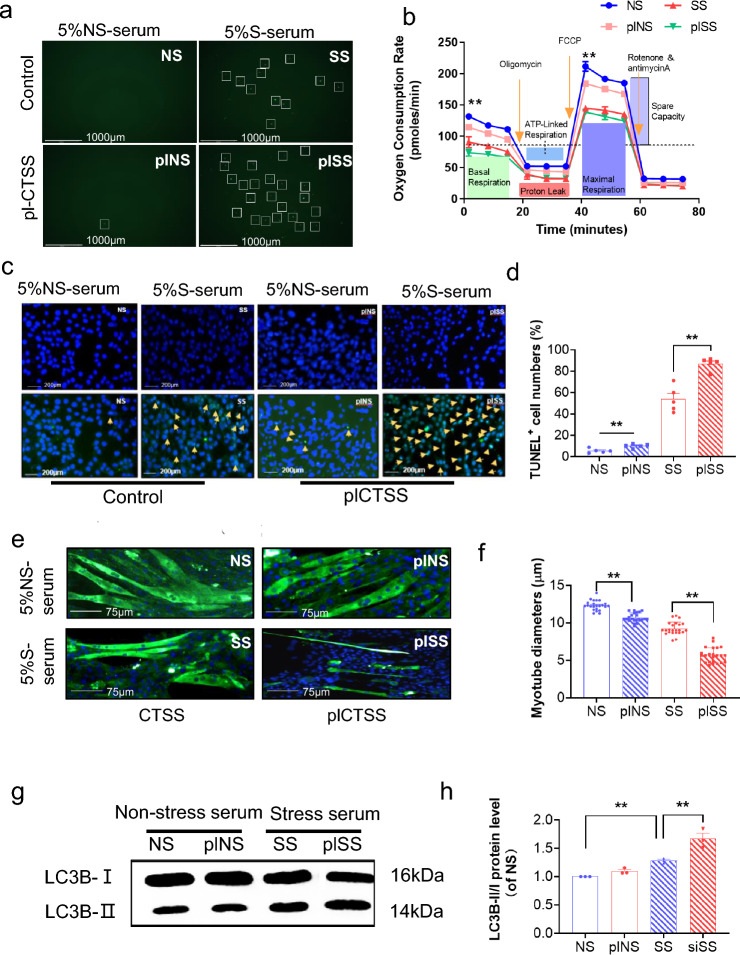
Fig. 9.
CTSS overexpression stimulated S-serum-induced C2C12 cell ROS produced, reduction in mitochondrial respiration, cell apoptosis and myotube atrophy. C2C12 cells were treated with pl-CTSS and empty plasmid for 48 h, cultured in 5% NS-serum or 5% S-serum for 24 h, and then subjected to Detection of ROS. a: Representative fluorescent microscopy images showing intracellular ROS in the four experimental groups. Scale bar: 1000 µm. b: The oxygen consumption rate measured using the Seahorse XFp assay in four groups of cells. c, d: Representative image of TUNEL immunofluorescence (c) and combined quantitative data (d) show the numbers of TUNEL+ apoptotic cells in the four experimental groups (n = 5). Yellow arrows: TUNEL+ cells. Scale bar: 200 µm. e: Myotubes treated with pl-CSTT or empty control plasmid were cultured in 5% S-serum for 72 h and then subjected to immunofluorescence staining for MHC (NS, SS, plNS, plSS). f: Quantification of the mean diameter of four groups. g: Representative immunoblotting images and (h) quantitative data for LC3B-II/I in the lysates from the four groups (n = 3). Data are mean ± SEM, and p-values were determined by one-way ANOVA followed by Tukey’s post hoc tests (b, d, f, h). NS: C2C12 cells treated non-targeting control RNA were cultured in 5% NS-serum for 24 h, siNS: CTSS-silenced C2C12 cells cultured in 5% NS-serum for 24 h, SS: C2C12 cells treated non-targeting control RNA were cultured in 5% S-serum for 24 h, siSS: CTSS-silenced C2C12 cells cultured in 5% S-serum for 24 h. *p < 0.05; **p < 0.01; NS, not significant

