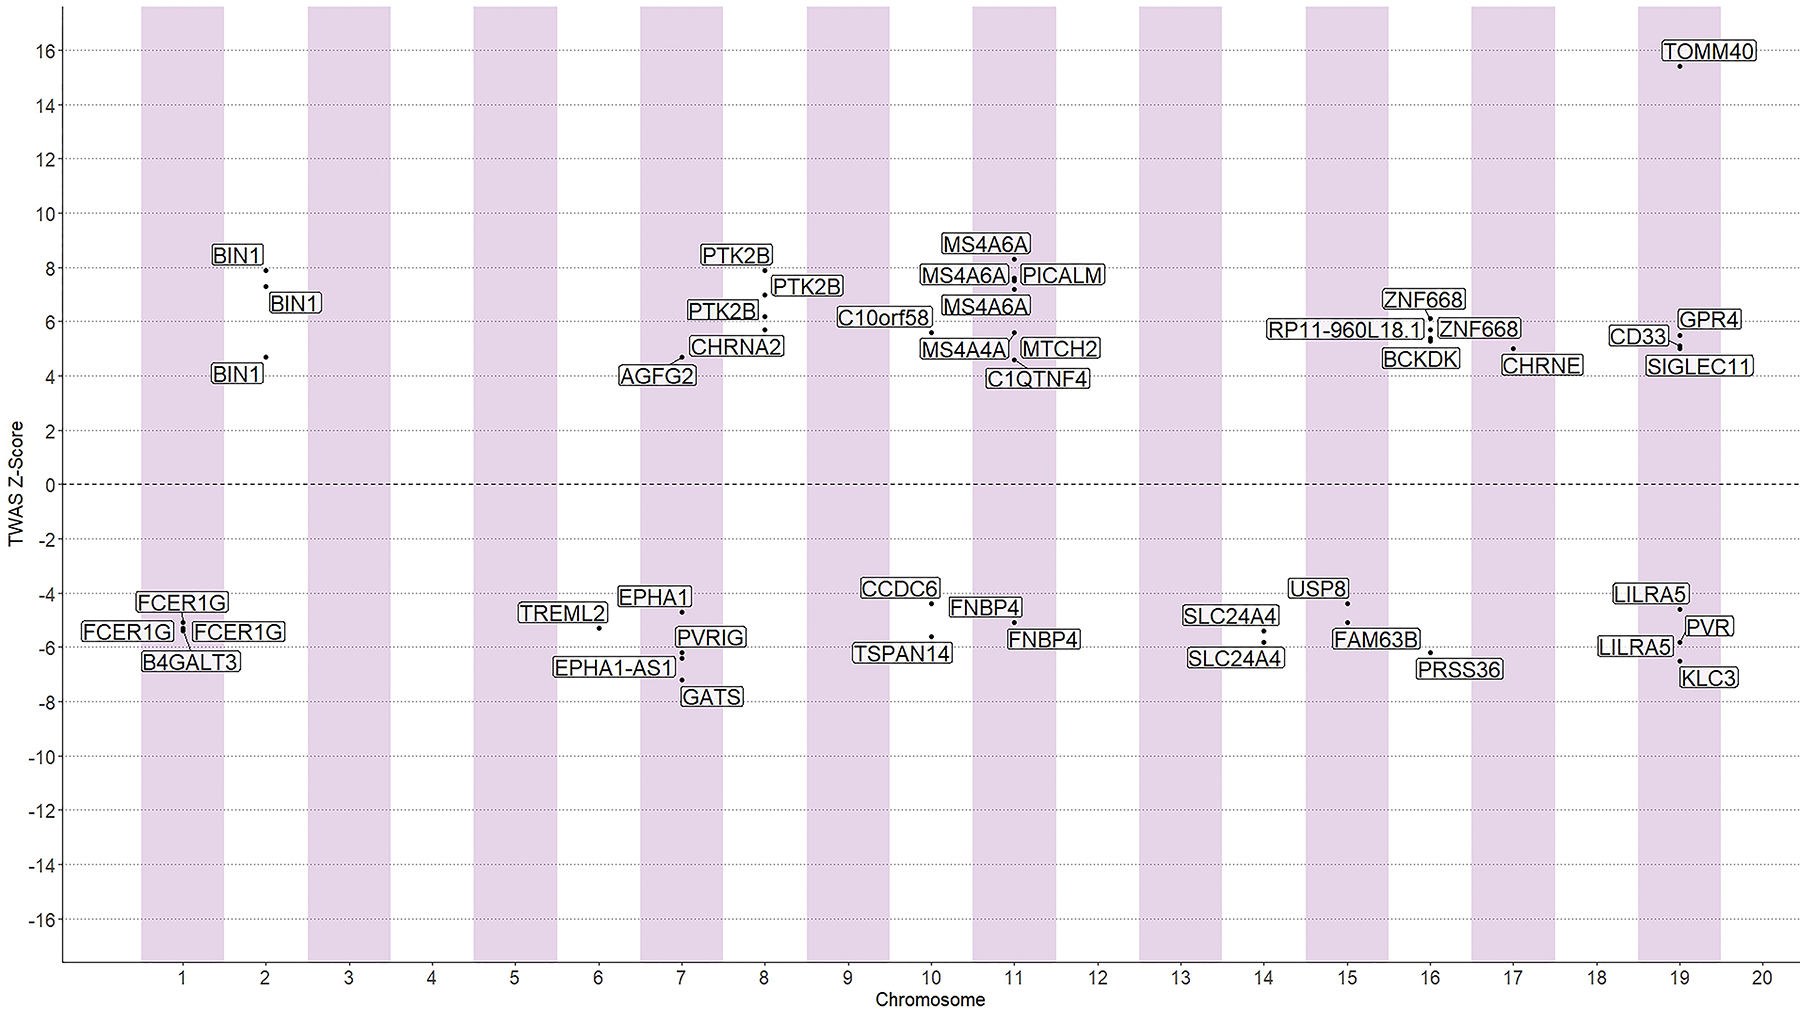
Figure 1:

Summary of TWAS results. Each data point represents a gene grouped by chromosome (x-axis) and its respective z-score (y-axis), illustrating the direction of effect for expression of transcripts encoding AD-related genes. Only significant transcriptome-wide associations are presented.
