Figure 1.
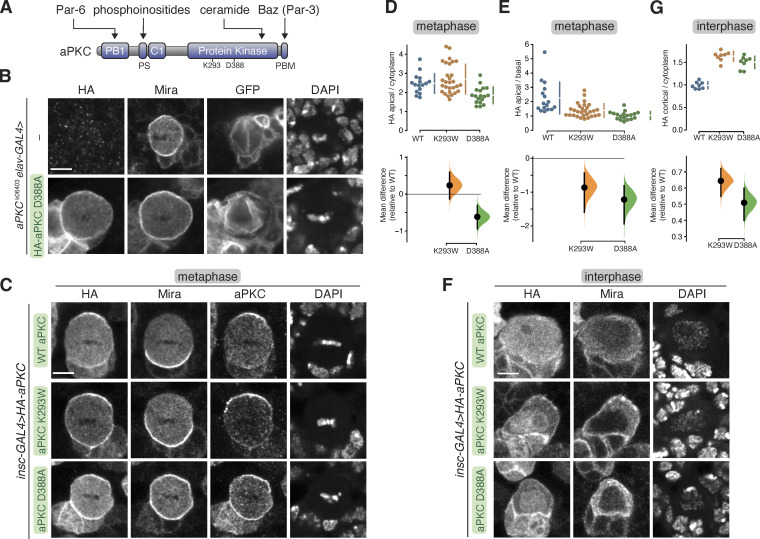
Localization of aPKC with kinase inactivating mutations in larval brain NSCs. (A) Domain structure of aPKC showing the location of PB1, PS (pseudosubstrate), C1, kinase domain, PBM (PDZ binding motif), along with the location of K293 and D388 residues. (B) Localization of HA-tagged aPKC harboring the D388A kinase inactivating mutation in metaphase, positively marked (mCD8-GFP) aPKCk06403 mutant larval brain NSC with an aPKCK06403 mutant larval brain NSC shown for comparison. Nucleic acids are shown with DAPI. The scale bar is 5 µm in all panels. (C) Localization of HA-tagged aPKC harboring either the D388A or K293W kinase inactivation mutations in metaphase larval brain NSCs with endogenous aPKC. The basal cortical marker Miranda, total aPKC (“aPKC,” endogenous and exogenously expressed) and nucleic acid (DAPI) are also shown. (D and E) Gardner-Altman estimation plots of the effect of the D388A and K293W mutations on metaphase aPKC membrane recruitment. Apical cortical to cytoplasmic (D) and apical/basal (E) signal intensities of anti-HA signals are shown for individual metaphase NSCs expressing either HA-WT or HA-D388A or HA-K293W aPKC. The error bar in the upper graph represents one standard deviation (gap is mean); the error bar in the lower graph represents bootstrap 95% confidence interval; n = 16 (from six distinct larval brains), 29 (8), 18 (4) for WT, K293W, D388A, respectively. (F) Localization of HA-tagged aPKC harboring either the D388A or K293W kinase inactivation mutations in interphase larval brain NSCs with endogenous aPKC. The basal cortical marker Miranda and nucleic acid (DAPI) are also shown. (G) Gardner–Altman estimation plot of the effect of the D388A and K293W mutations on interphase aPKC membrane recruitment. Cortical to cytoplasmic cortical signal intensities of anti-HA signals are shown for individual metaphase NSCs expressing either HA-WT or HA-D388A or HA-K293W aPKC. The error bar in upper graph represents one standard deviation (gap is mean); the error bar in the lower graph represents bootstrap 95% confidence interval; n = 8 for WT (from three distinct larval brains), K293W (3), and D388A (2).

