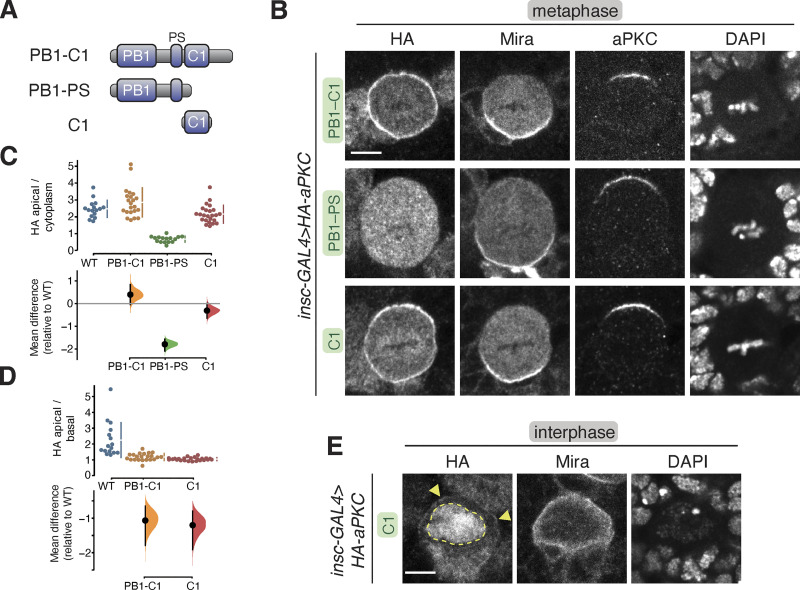
Figure 4.
Localization of the aPKC regulatory domain in larval brain NSCs. (A) aPKC regulatory domain fragments. (B) Localization of HA-tagged aPKC regulatory domain fragments in metaphase larval brain NSCs. The basal marker Miranda, endogenous aPKC (using an antibody that does not react with the regulatory domain), and nucleic acids (DAPI) are shown for comparison. Scale bar is 5 µm. (C and D) Gardner–Altman estimation plot of aPKC regulatory domain cortical localization (C) and polarity (D). Apical cortical to cytoplasmic (C) and apical cortical to basal cortical signal intensity ratios (D) of anti-HA signals are shown for individual metaphase NSCs expressing either aPKC PB1-C1, PB1-PS, or C1 regulatory domain fragments. The data for wild type is the same as in Fig. 1. Apical to basal ratios are only shown for proteins with detectable membrane signals. Error bar in the upper graphs represents one standard deviation (gap is mean); the error bar in the lower graphs represents bootstrap 95% confidence interval; n = 16 (from six distinct larval brains), 22 (6), 16 (5), 24 (9) for WT, PB1-C1, PB1-PS, and C1, respectively. (E) Localization of the HA-tagged aPKC C1 domain in interphase larval brain NSCs. Arrowheads highlight the membrane signal, and the nuclear signal is outlined by a dashed line.

