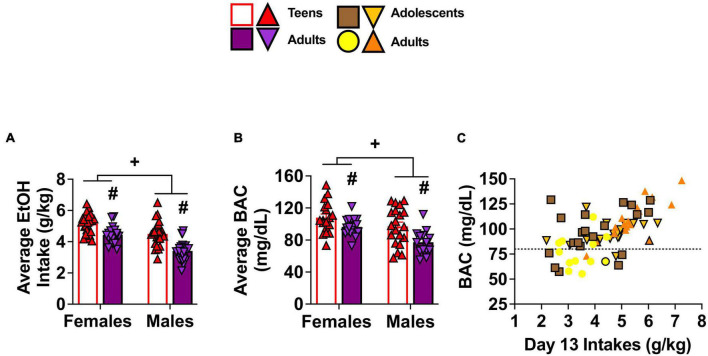
FIGURE 2.
Depiction of age and sex differences in alcohol intake and corresponding BACs. As there were no Withdrawal effects or interactions, the data for alcohol intake and BACs are collapsed across mice slated to be tested on WD1 and WD30. (A) On average, adolescent (Adol.) mice consumed more alcohol than adult mice and females consumed more than males [females: adolescents (n = 24), adults (n = 20); males: adolescents (n = 24), adults (n = 24)]. (B) The average BAC levels obtained on Day 13 of drinking paralleled group differences in alcohol intake [females: adolescents (n = 18), adults (n = 18); males: adolescents (n = 20), adults (n = 14)] and (C) a positive correlation was observed between BACs and alcohol consumption on Day 13 of drinking [sample sizes same as panel (B)]. The data in panels (A,B) are presented as the means ± SEMs for the respective number of mice indicated above. +p < 0.05, Female vs. Male (main Sex effect); #p < 0.05, adolescents vs. adults (main Age effect).

