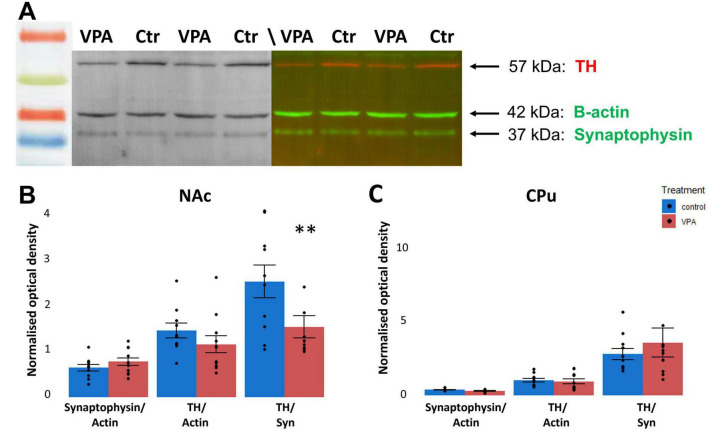
FIGURE 10.
Proteomic analysis (WB) of TH protein relative to synaptophysin in the NAc of VPA-treated animals, compared to controls. The top panel (A) shows representative tracks of gels doubly labeled against TH (red) and synaptophysin (green), allowing for direct comparison. The housekeeping protein β-actin (also appearing green) was used for loading control. The diagrams on the bottom panel (B,C) show quantitative data of the systematic comparison between control and VPA-exposed specimens from the NAc or the CPu. The data are expressed as M ± S.E.M. n = 11 brains (VPA), n = 11 brains (control). **p < 0.01.

