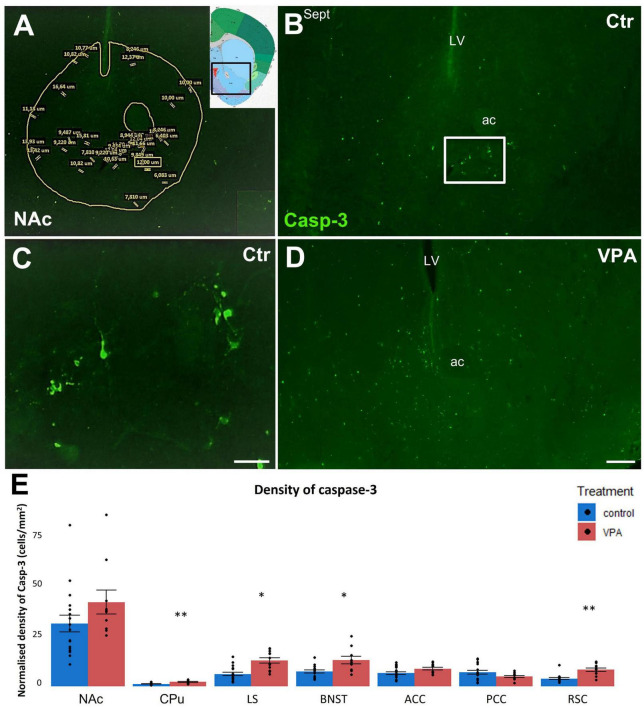
FIGURE 4.
(A–D): Representative fluorescence microscope images demonstrating the distribution of apoptotic (Casp3 +) cells of P7 mice born to VPA-treated (VPA) to vehicle-treated (Ctr) mothers. A typical example for the segmentation of the region of interest (ROI) on each tissue section (here the NAc) is demonstrated on image (A), the inset shows the position of this region on the reference atlas figure. Within the ROI (areas of tracts excluded), all Casp3 + elements which met the preset shape and size criteria (the size values are displayed here for demonstration purpose only) were counted as apoptotic cells. Image (B) shows the accumulation of apoptotic cells in the NAc of control mouse (Ctr), the framed area appears under higher magnification in Image (C), for better visualization of the neuronal architecture of Casp3 + structures. Compared to control, apoptotic cells appear more abundant in the same region of the VPA mouse [Image (D)]. Notably, due to high variability, this prominent trend failed to attain significance level in the NAc, whereas, in most other regions, the VPA-associated surge of apoptosis was significant. Abbreviations on images: ac, anterior commissure; Sept, septum; LV, lateral ventricle. Scale bars: 200 μm (B,D), 50 μm (C). The attached graph (E) shows the areal density of Casp3 + cells in several subpallial and pallial regions, comparing VPA-exposed (n = 10–12) and control (n = 17–20) hemispheres (depending on the intactness of given brain regions), representing 6 and 10 animals, respectively. The values are expressed as M ± S.E.M. *p < 0.05, **p < 0.01. NAc, nucleus accumbens; CPu, caudate-putamen; LS, lateral septum; BNST, bed nucleus of stria terminalis; ACC, anterior cingulate cortex; PCC, posterior cingulate cortex; RSC, retrosplenial cortex.

