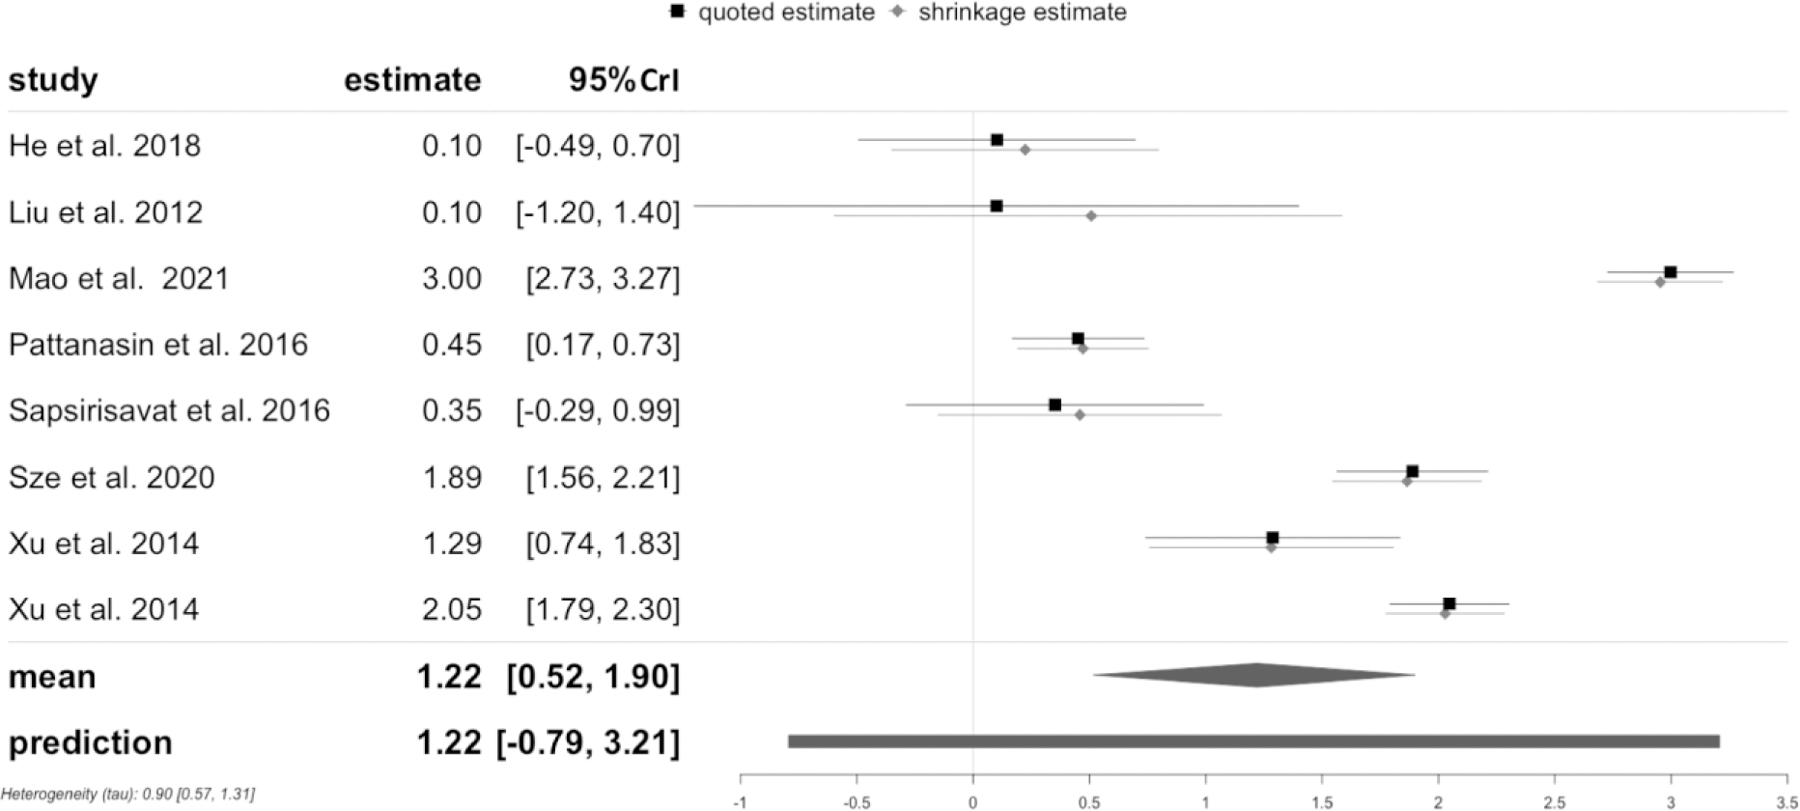
Figure 5. Forest plot of the association of MSM living with HIV in comparison to MSM living without HIV in chemsex activity computed with Bayesian approach with half normal distribution prior (scale of 0.5).

Note. 95% CrI = 95% credible interval. The black line indicates the quoted estimates specified through effect from individual study and its σi as same as in the frequentist approach. The grey line presents the shrinkage intervals which illustrate the posterior of each studyʼs true effect. The black diamond presents the posterior distribution of the pooled effect while the black bar shows the prediction distribution. The scale on the x-axis is log odds ratio.
