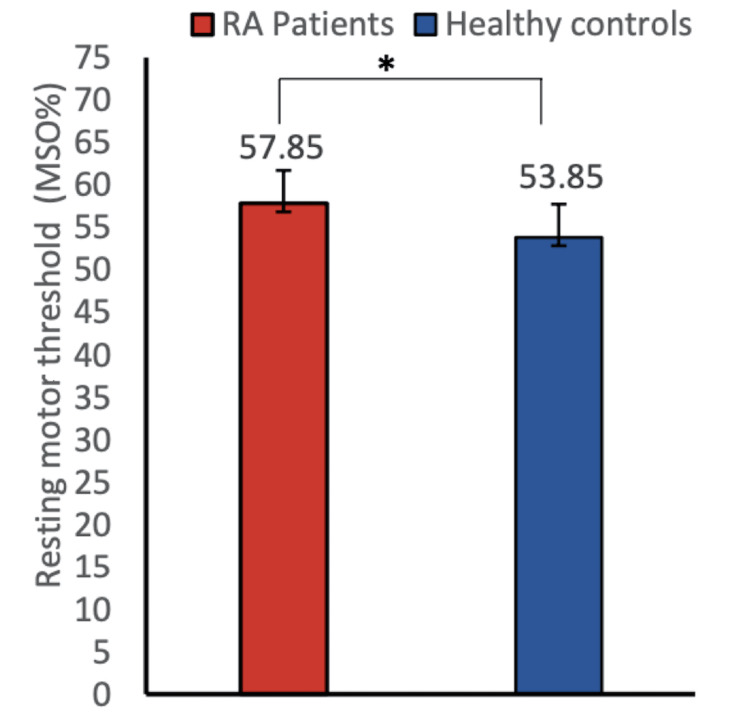
Figure 2. Resting motor threshold of RA patients and healthy controls.
This figure shows the comparison of RMT between healthy controls and rheumatoid arthritis patients. RMT was found to be significantly higher in rheumatoid arthritis patients as compared to healthy controls (mean ± SD 57.85 ± 6.64 vs. 53.85 ± 3.9, P = 0.0264). Data were checked for normality using the Shapiro-Wilk normality test. A two-group comparison was done by the standard t-test. Data have been expressed as mean ± SD. Asterisk sign represents the significant P-value.
RA, rheumatoid arthritis; RMT, resting motor threshold.

