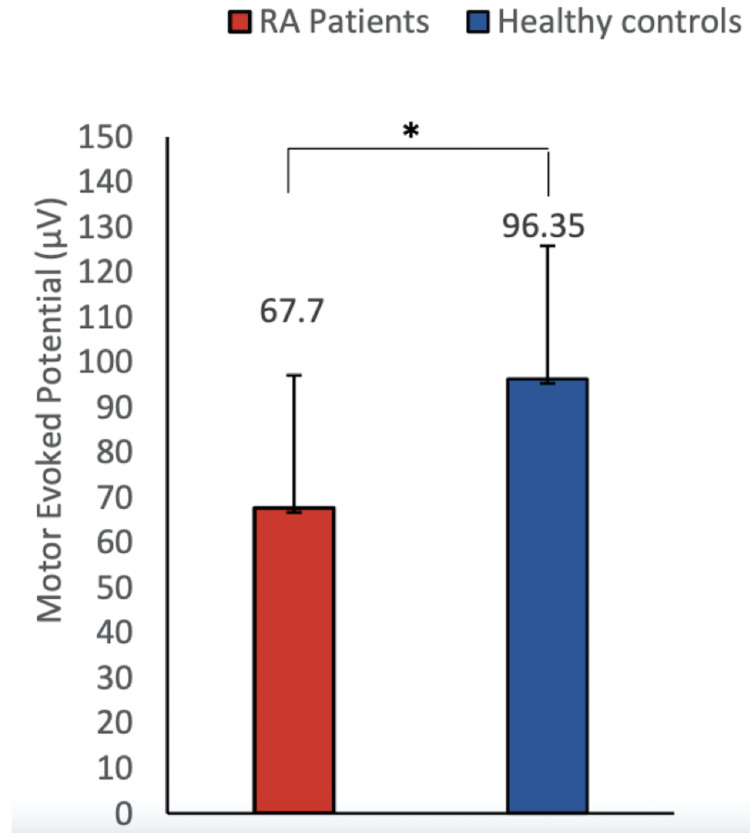
Figure 3. A comparison of MEP between RA patients and healthy controls.
This figure shows the MEP comparison between healthy controls and RA patients. MEP was found to be significantly lower in RA patients as compared to healthy controls (mean ± SD 67.7 ± 12.33 vs 96.35 ± 29.45; P = 0.0136). Data were checked for normality using the Shapiro-Wilk normality test. A two-group comparison was done by standard t-test. Asterisk sign represents the significant P-value.
MEP, motor evoked potential; RA, rheumatoid arthritis.

