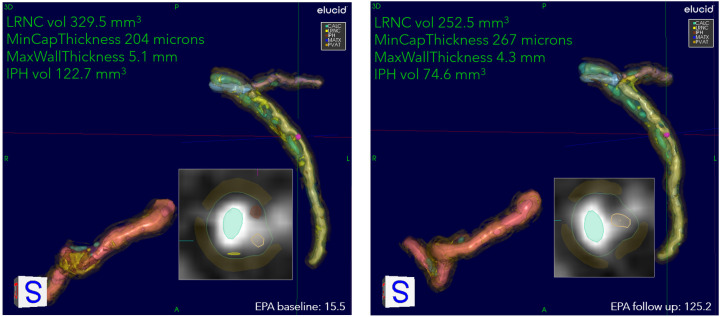
Figure 4.
An example of stabilization/regression of patient on IPE. Overview of quantitation at two encounters of a patient on drug: 53-year-old White female, baseline serum EPA 15.5, increasing to 125.2 at the 9-month follow-up. The 3D view of RCA, LAD, and LCX, with corner annotations for left coronary. The baseline values for LRNC volume, minimum cap thickness, maximum wall thickness, and IPH volume are 329.5 mm3, 204 μm, 5.1 mm, and 122.7 mm3, respectively. At follow-up, LRNC decreased to 252.5 mm3, IPH to 74.6 mm3, cap thickness increased to 267 μm, and wall thickness decreased to 4.3 mm. The presentation of residual LRNC indicates splitting into smaller lipid pools from larger contiguous cores at baseline. The 2D cross-section located at cursors in 3D representation shown as insets. Serum EPA values for baseline and follow-up are also shown.

