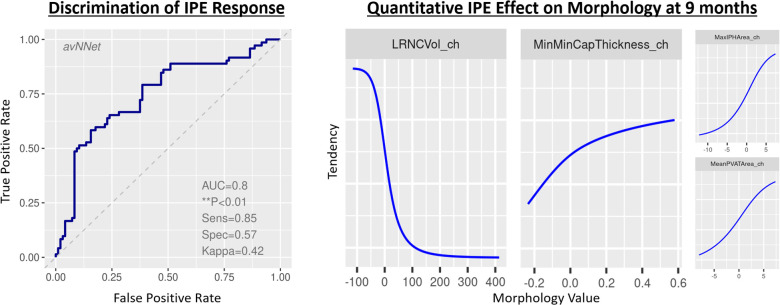
Figure 5.
Classifier to infer patient representation that encodes meaningful changes in morphology. Model performance identifying relationships among quantitative plaque change features and drug response. LEFT: Receiver operating characteristic curve for the best-fit model on total coronary burden with quantitation formed by summing volumes, scaling proportions, and applying maxima, minima, and mean values across 3D regions of principal coronary arteries inclusive of anatomic and tissue characteristic regions. RIGHT: identification of feature tendencies stated in terms of probability of being on drug, where _ch suffix signifies change in the variable.

