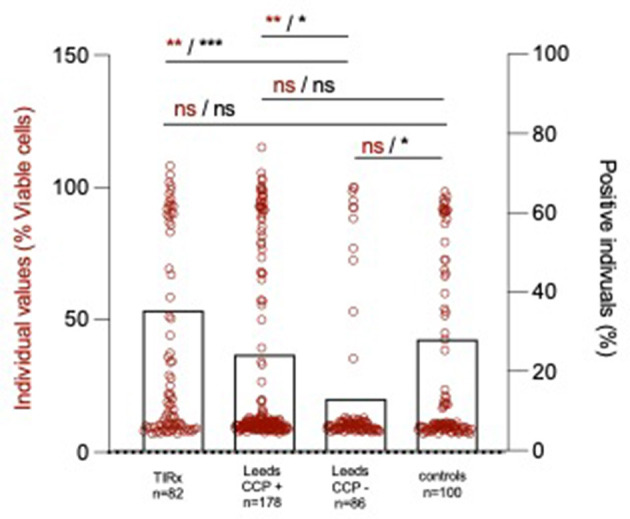
Figure 1.

Individual anti-LtxA levels (red circles and statistical notations in red) and percentage positive individuals (black bars, mean ± SD and statistical notations in black). *p < 0.05, **p < 0.01, and ***p < 0.001.

Individual anti-LtxA levels (red circles and statistical notations in red) and percentage positive individuals (black bars, mean ± SD and statistical notations in black). *p < 0.05, **p < 0.01, and ***p < 0.001.