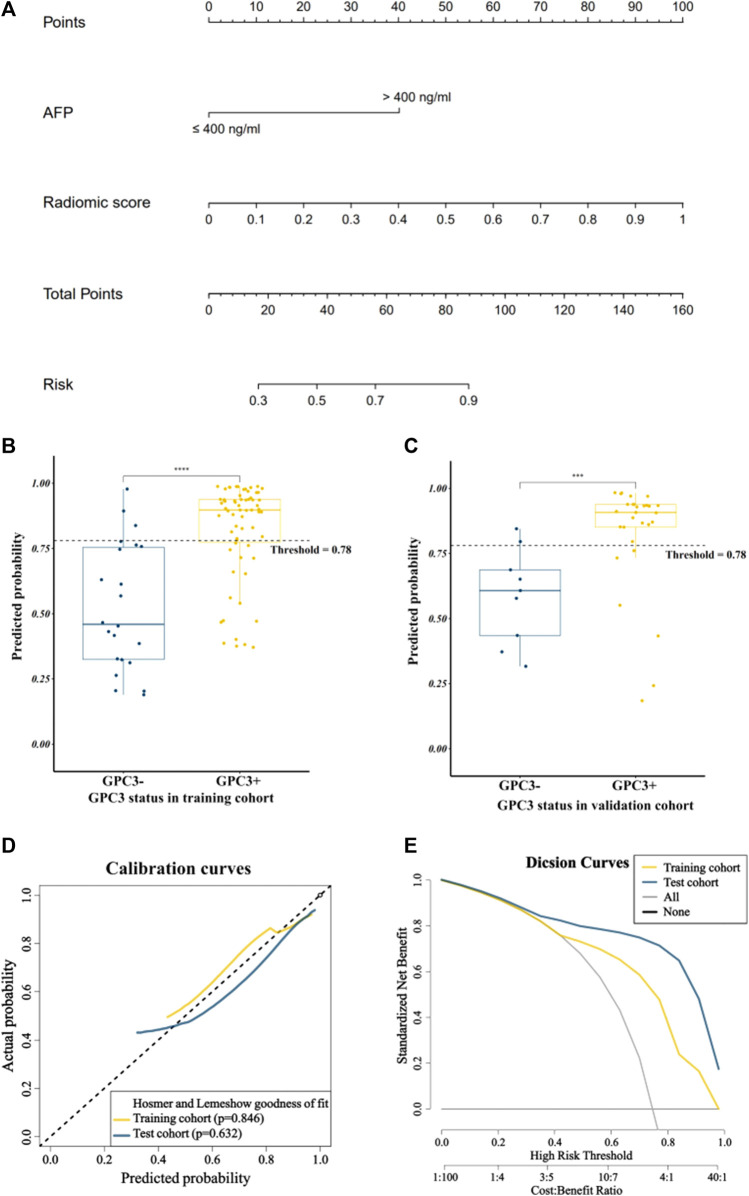
FIGURE 4.
Visualization and evaluation of the comprehensive model. (A) Nomogram based on clinical risk factor AFP combined with radiomics score; (B) and (C) represent box plots showing the distribution of patients’ GPC3-positive probability in the training and validation cohorts; **** for p < 0.0001 and *** for p < 0.01 by the Mann–Whitney U test; (D) calibration curves; (E) decision curves.

