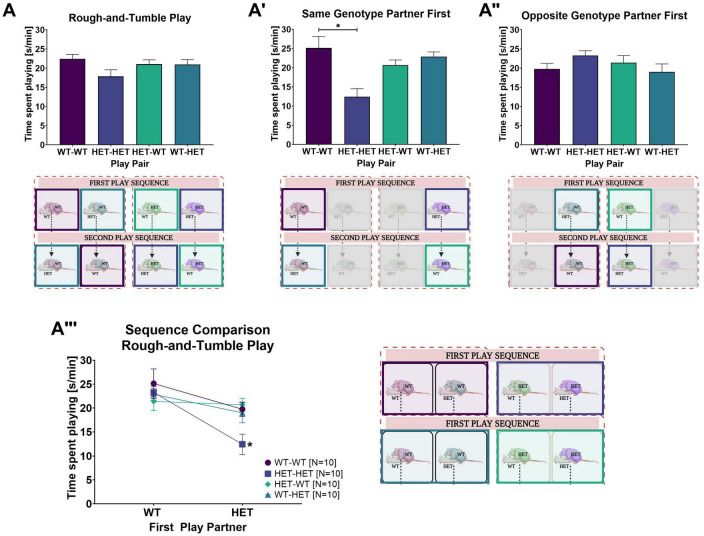
FIGURE 2.
Rough-and-tumble play behavior and effects of the first play partner. The following data are pooled for genotype of the cage mate. Pair data included in the graphs are represented by the equivalent colored boxes surrounding the pairs of female rats in the representative design figure placed below or beside each graph (WT-WT = Dark Purple, HET-HET = Purple, HET-WT = Light Green, WT-HET = Dark Green, Greyed out boxes = not included). (A) The total averaged time spent playing for all six play sessions in pairs of female WT-WT (Dark purple bars, N = 20), HET-HET (Purple bars, N = 20), HET-WT (Light green bars, N = 20), and WT-HET (Dark green bars, N = 20). (A’,A”) The total averaged time spent playing across all three play sessions with a same- or opposite genotype play partner in pairs of female WT-WT (Dark purple bars, N = 10), HET-HET (Purple bars, N = 10), HET-WT (Light green bars, N = 10) and WT-HET (Dark green bars, N = 10). (A”’) The sequence comparison of time spent playing depending on genotype of the first play partner within female pairs of WT-WT (Dark purple circles, N = 10), HET-HET (Purple boxes, N = 10), HET-WT (Green diamonds, N = 10) and WT-HET (Dark green triangles, N = 10). Data are presented as mean + SEM. *p < 0.05.

