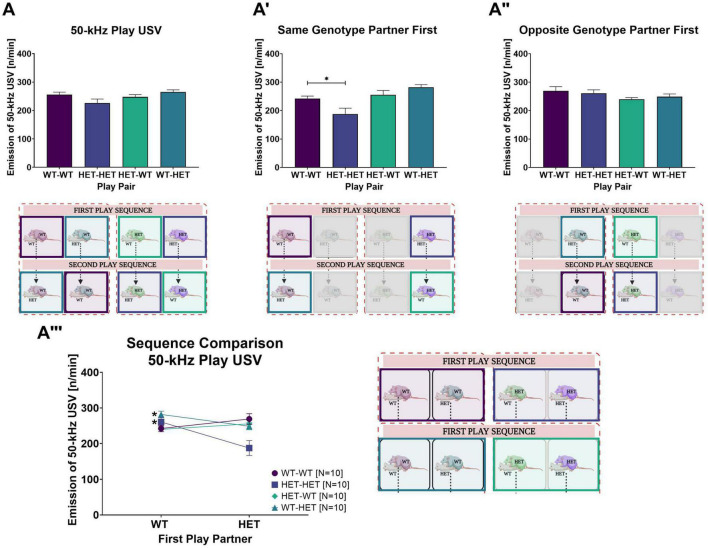
FIGURE 4.
Rough-and-Tumble induced 50-kHz USV. The following data are pooled for genotype of the cage mate. Pair data included in the graphs are represented by the equivalent-colored boxes surrounding the pairs of female rats in the representative design figure placed below or beside each graph (WT-WT = Dark Purple, HET-HET = Purple, HET-WT = Light Green, WT-HET = Dark Green, Greyed out boxes = not included). (A) The total 50-kHz USV emissions averaged across all sessions in pairs of female WT-WT (Dark purple bars, N = 20), HET-HET (Purple bars, N = 20), HET-WT (Light green bars, N = 20) and WT-HET (Dark green bars, N = 20); (A’,A”) The number of 50-kHz USV emission (n/min) averaged across all sessions while playing with a same- or opposite genotype play partner in pairs of female WT-WT (Dark purple bars, N = 10), HET-HET (Purple bars, N = 10), HET-WT (Light green bars, N = 10) and WT-HET (Dark green bars, N = 10). (A”’) The sequence comparison of 50-kHz USV (n/min) emissions averaged across all sessions during social play depending on genotype of the first play partner in female pairs of WT-WT (Dark purple circles), HET-HET (Purple boxes), HET-WT (Green diamonds), and WT-HET (Dark green triangles). Data are presented as mean + SEM. *p < 0.05.

