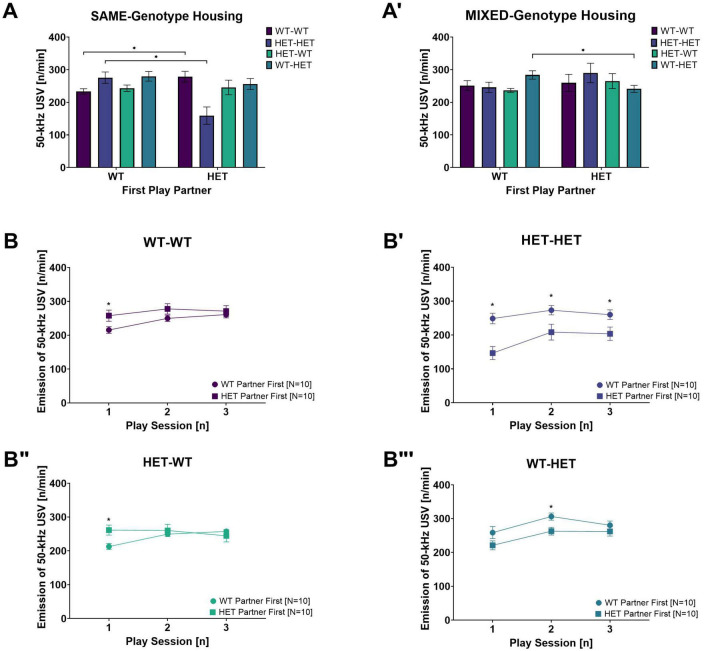
FIGURE 5.
Rough-and-Tumble Induced 50-kHz USV across sessions and effects of the first play partner and housing. The total number of 50-kHz USV emissions per min averaged across all play sessions depending on the genotype of the first play partner in (A) SAME-genotype housing and (A’) MIXED-genotype housing for pairs of female WT-WT (Dark purple bars, N = 5), HET-HET (Purple bars, N = 5), HET-WT (Light green bars, N = 5) and WT-HET (Dark green bars, N = 5). (B–B”’) Data are pooled for genotype of the cage mate. The emission of 50-kHz USV across each individual play session depending on genotype of the first play partner (WT partner first = circles and HET partner first = squares) in female pairs of (B) WT-WT, (B’) HET-HET, (B”) HET-WT and (B”’) WT-HET; Data are presented as mean + SEM. *p < 0.05.

